|
Download Data (XLS File) |
|
||||||||
|
||||||||
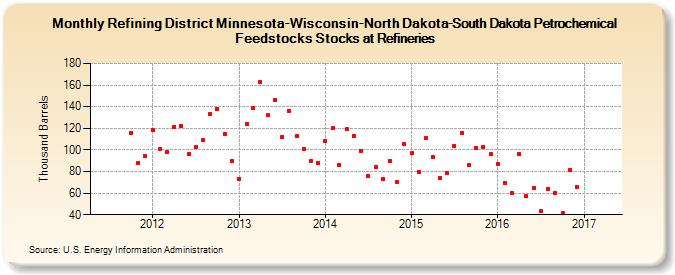
| Refining District Minnesota-Wisconsin-North Dakota-South Dakota Petrochemical Feedstocks Stocks at Refineries (Thousand Barrels) | ||||||||
| Year | Jan | Feb | Mar | Apr | May | Jun | Jul | Aug | Sep | Oct | Nov | Dec |
|---|---|---|---|---|---|---|---|---|---|---|---|---|
| 2011 | 116 | 88 | 94 | |||||||||
| 2012 | 118 | 101 | 98 | 121 | 122 | 96 | 103 | 109 | 133 | 138 | 115 | 90 |
| 2013 | 73 | 124 | 139 | 163 | 132 | 146 | 112 | 136 | 113 | 101 | 90 | 88 |
| 2014 | 108 | 120 | 86 | 119 | 113 | 99 | 76 | 84 | 73 | 90 | 70 | 105 |
| 2015 | 97 | 80 | 111 | 93 | 74 | 79 | 104 | 116 | 86 | 102 | 103 | 96 |
| 2016 | 87 | 69 | 60 | 96 | 57 | 65 | 43 | 64 | 60 | 42 | 81 | 66 |
| 2017 | 58 | 69 | 61 | 62 | 90 | |||||||
| - = No Data Reported; -- = Not Applicable; NA = Not Available; W = Withheld to avoid disclosure of individual company data. |
| Release Date: 3/29/2024 |
| Next Release Date: 4/30/2024 |