|
Download Data (XLS File) |
|
||||||||
|
||||||||
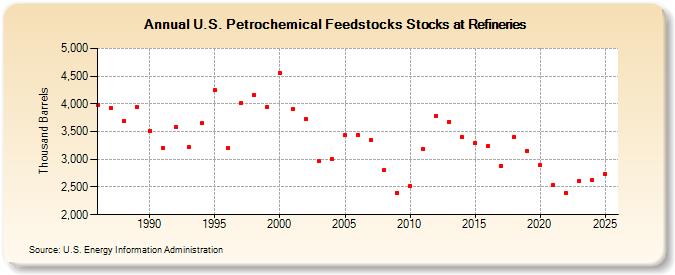
| U.S. Petrochemical Feedstocks Stocks at Refineries (Thousand Barrels) | ||||||||
| Decade | Year-0 | Year-1 | Year-2 | Year-3 | Year-4 | Year-5 | Year-6 | Year-7 | Year-8 | Year-9 |
|---|---|---|---|---|---|---|---|---|---|---|
| 1980's | 3,980 | 3,928 | 3,697 | 3,945 | ||||||
| 1990's | 3,511 | 3,205 | 3,576 | 3,228 | 3,649 | 4,249 | 3,200 | 4,007 | 4,160 | 3,951 |
| 2000's | 4,564 | 3,905 | 3,722 | 2,960 | 2,998 | 3,431 | 3,440 | 3,350 | 2,809 | 2,397 |
| 2010's | 2,519 | 3,178 | 3,783 | 3,679 | 3,406 | 3,287 | 3,240 | 2,883 | 3,404 | 3,154 |
| 2020's | 2,888 | 2,540 | 2,388 | 2,617 |
| - = No Data Reported; -- = Not Applicable; NA = Not Available; W = Withheld to avoid disclosure of individual company data. |
| Release Date: 3/29/2024 |
| Next Release Date: 8/30/2024 |