|
Download Data (XLS File) |
|
||||||||
|
||||||||
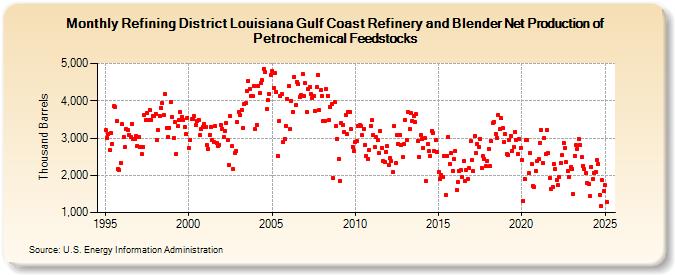
| Refining District Louisiana Gulf Coast Refinery and Blender Net Production of Petrochemical Feedstocks (Thousand Barrels) | ||||||||
| Year | Jan | Feb | Mar | Apr | May | Jun | Jul | Aug | Sep | Oct | Nov | Dec |
|---|---|---|---|---|---|---|---|---|---|---|---|---|
| 1995 | 3,205 | 3,000 | 3,104 | 2,672 | 3,131 | 2,852 | 3,851 | 3,842 | 3,456 | 2,173 | 2,139 | 2,341 |
| 1996 | 3,365 | 3,033 | 2,755 | 3,232 | 3,228 | 3,084 | 3,023 | 3,380 | 2,980 | 2,982 | 3,050 | 2,789 |
| 1997 | 3,038 | 2,757 | 2,562 | 2,747 | 3,623 | 3,478 | 3,678 | 3,491 | 3,765 | 3,485 | 3,599 | 3,591 |
| 1998 | 3,655 | 2,953 | 3,210 | 3,600 | 3,818 | 3,930 | 3,623 | 4,172 | 3,277 | 3,018 | 3,277 | 3,956 |
| 1999 | 3,564 | 2,995 | 3,425 | 2,573 | 3,315 | 3,480 | 3,694 | 3,577 | 3,487 | 3,294 | 3,101 | 3,548 |
| 2000 | 2,731 | 2,946 | 3,503 | 3,504 | 3,581 | 3,338 | 3,467 | 3,495 | 3,074 | 3,231 | 3,304 | 3,373 |
| 2001 | 3,290 | 2,805 | 2,718 | 3,085 | 3,307 | 2,941 | 2,887 | 3,319 | 2,863 | 2,791 | 2,826 | 3,360 |
| 2002 | 3,253 | 3,027 | 3,182 | 3,415 | 2,947 | 2,272 | 3,588 | 2,775 | 2,167 | 2,603 | 2,645 | 3,430 |
| 2003 | 3,704 | 3,626 | 3,756 | 3,274 | 3,911 | 3,931 | 4,266 | 4,542 | 4,311 | 4,127 | 4,115 | 4,407 |
| 2004 | 3,233 | 3,361 | 4,396 | 4,203 | 4,479 | 4,545 | 4,861 | 4,769 | 3,767 | 4,019 | 4,168 | 4,681 |
| 2005 | 4,804 | 4,353 | 4,735 | 4,223 | 2,528 | 3,449 | 4,115 | 4,186 | 2,881 | 2,987 | 3,326 | 4,059 |
| 2006 | 4,405 | 3,245 | 4,002 | 3,708 | 4,642 | 3,877 | 4,510 | 4,447 | 4,100 | 4,156 | 4,712 | 4,123 |
| 2007 | 4,465 | 3,695 | 4,311 | 4,367 | 4,187 | 4,065 | 4,120 | 3,736 | 4,373 | 4,703 | 3,747 | 4,281 |
| 2008 | 4,126 | 3,459 | 3,470 | 4,319 | 4,137 | 3,479 | 3,831 | 3,900 | 1,914 | 3,957 | 3,312 | 2,977 |
| 2009 | 2,440 | 1,849 | 3,398 | 3,359 | 3,150 | 3,620 | 3,097 | 3,700 | 3,686 | 3,233 | 2,770 | 2,644 |
| 2010 | 2,906 | 2,921 | 3,313 | 3,342 | 3,322 | 3,076 | 3,254 | 2,813 | 2,521 | 2,425 | 2,689 | 3,334 |
| 2011 | 3,477 | 3,082 | 2,755 | 3,027 | 2,949 | 2,597 | 3,184 | 2,741 | 2,375 | 2,351 | 2,632 | 2,773 |
| 2012 | 2,283 | 2,457 | 2,382 | 2,075 | 3,325 | 2,322 | 3,088 | 2,852 | 3,073 | 2,804 | 2,482 | 2,829 |
| 2013 | 3,491 | 2,944 | 3,685 | 3,236 | 3,678 | 3,452 | 3,587 | 3,426 | 3,641 | 2,924 | 2,503 | 3,084 |
| 2014 | 2,964 | 2,745 | 2,996 | 1,836 | 2,842 | 2,649 | 2,520 | 3,198 | 3,132 | 2,650 | 2,939 | 2,619 |
| 2015 | 2,085 | 1,889 | 2,016 | 1,963 | 2,510 | 1,478 | 2,530 | 3,040 | 2,303 | 2,594 | 2,116 | 2,439 |
| 2016 | 2,657 | 1,618 | 1,822 | 2,120 | 2,141 | 1,952 | 2,381 | 1,852 | 2,146 | 1,903 | 2,188 | 2,907 |
| 2017 | 2,416 | 2,104 | 3,050 | 2,594 | 2,840 | 2,764 | 2,973 | 2,192 | 2,513 | 2,450 | 2,236 | 2,396 |
| 2018 | 2,709 | 2,236 | 2,909 | 3,411 | 3,443 | 3,116 | 3,009 | 3,608 | 3,235 | 3,528 | 3,256 | 2,892 |
| 2019 | 3,108 | 2,562 | 2,544 | 2,956 | 3,063 | 2,662 | 2,756 | 3,156 | 2,955 | 2,573 | 2,977 | 2,740 |
| 2020 | 2,422 | 1,305 | 1,906 | 2,935 | 2,952 | 2,049 | 2,606 | 2,297 | 1,716 | 1,688 | 2,117 | 2,374 |
| 2021 | 2,424 | 2,878 | 3,219 | 2,334 | 3,008 | 2,560 | 3,223 | 2,598 | 1,927 | 1,630 | 1,683 | 2,310 |
| 2022 | 2,163 | 1,874 | 1,734 | 1,951 | 2,326 | 2,536 | 2,876 | 2,737 | 2,348 | 2,116 | 1,954 | 2,221 |
| 2023 | 2,165 | 1,496 | 2,526 | 2,809 | 2,717 | 2,964 | 2,820 | 2,479 | 2,262 | 2,158 | 2,067 | 1,806 |
| 2024 | 1,760 | |||||||||||
| - = No Data Reported; -- = Not Applicable; NA = Not Available; W = Withheld to avoid disclosure of individual company data. |
| Release Date: 3/29/2024 |
| Next Release Date: 4/30/2024 |