|
Download Data (XLS File) |
|
||||||||
|
||||||||
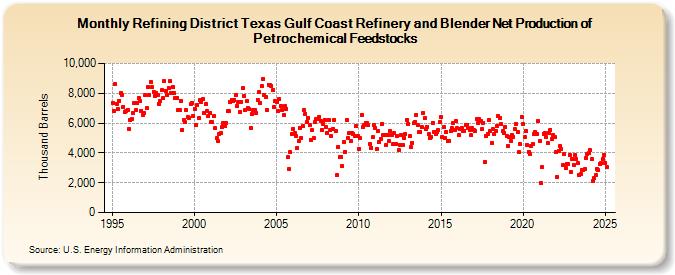
| Refining District Texas Gulf Coast Refinery and Blender Net Production of Petrochemical Feedstocks (Thousand Barrels) | ||||||||
| Year | Jan | Feb | Mar | Apr | May | Jun | Jul | Aug | Sep | Oct | Nov | Dec |
|---|---|---|---|---|---|---|---|---|---|---|---|---|
| 1995 | 7,381 | 6,825 | 8,598 | 7,295 | 6,937 | 7,508 | 8,027 | 7,905 | 7,111 | 6,772 | 6,796 | 6,909 |
| 1996 | 5,614 | 6,230 | 6,271 | 6,645 | 7,366 | 6,855 | 7,323 | 7,671 | 7,450 | 6,842 | 6,545 | 6,692 |
| 1997 | 7,872 | 6,983 | 8,428 | 7,872 | 8,758 | 8,400 | 8,116 | 7,834 | 8,025 | 7,898 | 7,305 | 7,465 |
| 1998 | 8,188 | 7,675 | 8,829 | 8,176 | 7,865 | 8,368 | 8,822 | 8,047 | 8,444 | 7,993 | 7,672 | 7,681 |
| 1999 | 6,889 | 6,911 | 7,504 | 5,559 | 6,176 | 6,057 | 6,852 | 6,381 | 6,352 | 7,249 | 7,368 | 6,481 |
| 2000 | 6,961 | 5,899 | 7,228 | 6,327 | 7,520 | 7,428 | 7,585 | 6,686 | 7,277 | 6,780 | 6,496 | 6,710 |
| 2001 | 6,060 | 6,042 | 6,468 | 5,667 | 4,983 | 4,767 | 5,293 | 5,334 | 5,719 | 6,016 | 5,811 | 5,996 |
| 2002 | 6,790 | 6,786 | 7,425 | 7,568 | 7,460 | 7,546 | 7,859 | 7,122 | 7,419 | 6,774 | 7,440 | 8,340 |
| 2003 | 7,837 | 6,859 | 7,452 | 7,008 | 6,944 | 5,678 | 6,629 | 6,850 | 6,856 | 6,679 | 7,581 | 8,119 |
| 2004 | 7,371 | 8,480 | 8,981 | 7,858 | 7,725 | 6,890 | 8,590 | 8,540 | 8,474 | 8,213 | 7,089 | 7,466 |
| 2005 | 7,424 | 6,803 | 7,593 | 7,175 | 6,901 | 6,547 | 7,152 | 6,967 | 3,701 | 2,918 | 4,029 | 5,267 |
| 2006 | 5,598 | 5,324 | 5,136 | 4,322 | 4,807 | 5,698 | 5,030 | 5,802 | 6,870 | 6,614 | 6,082 | 6,371 |
| 2007 | 5,894 | 4,860 | 5,520 | 4,985 | 6,088 | 6,264 | 6,270 | 6,429 | 6,148 | 5,559 | 5,964 | 6,235 |
| 2008 | 5,735 | 5,348 | 6,240 | 5,516 | 5,123 | 5,626 | 6,234 | 5,485 | 2,488 | 4,424 | 3,695 | 3,759 |
| 2009 | 3,107 | 4,760 | 4,085 | 6,229 | 4,978 | 5,304 | 4,785 | 5,337 | 5,275 | 5,123 | 5,801 | 5,157 |
| 2010 | 4,264 | 4,981 | 6,560 | 5,751 | 5,894 | 6,020 | 6,014 | 5,843 | 4,591 | 4,348 | 5,042 | 5,857 |
| 2011 | 5,678 | 4,257 | 5,465 | 4,753 | 4,965 | 5,972 | 5,177 | 5,186 | 4,547 | 5,206 | 4,807 | 5,481 |
| 2012 | 5,207 | 4,584 | 5,333 | 4,608 | 5,127 | 4,171 | 4,551 | 5,187 | 4,521 | 5,019 | 5,271 | 6,236 |
| 2013 | 5,960 | 5,111 | 4,366 | 4,683 | 5,976 | 6,098 | 6,549 | 5,840 | 5,404 | 5,406 | 5,731 | 6,699 |
| 2014 | 6,342 | 5,601 | 5,762 | 5,245 | 5,020 | 5,054 | 6,038 | 5,421 | 5,301 | 5,419 | 5,535 | 6,078 |
| 2015 | 6,401 | 5,089 | 5,724 | 5,010 | 5,404 | 4,825 | 4,831 | 5,458 | 5,641 | 6,022 | 5,511 | 6,119 |
| 2016 | 5,666 | 5,173 | 5,621 | 5,691 | 5,498 | 5,471 | 5,880 | 5,894 | 5,679 | 5,571 | 5,172 | 5,671 |
| 2017 | 5,519 | 5,467 | 6,284 | 6,004 | 6,273 | 6,133 | 5,573 | 6,041 | 3,409 | 5,109 | 5,295 | 6,221 |
| 2018 | 5,504 | 4,669 | 5,591 | 5,241 | 5,471 | 5,818 | 6,490 | 6,371 | 5,915 | 5,442 | 5,361 | 5,750 |
| 2019 | 5,157 | 4,475 | 5,078 | 4,827 | 5,232 | 5,081 | 5,603 | 5,970 | 5,406 | 4,058 | 4,589 | 6,438 |
| 2020 | 5,934 | 5,062 | 5,499 | 4,540 | 4,082 | 3,939 | 4,449 | 4,593 | 5,264 | 5,402 | 5,260 | 6,153 |
| 2021 | 4,779 | 1,985 | 3,036 | 5,294 | 5,341 | 5,038 | 4,639 | 5,362 | 5,569 | 4,922 | 5,231 | 5,071 |
| 2022 | 4,037 | 2,370 | 4,143 | 4,448 | 4,242 | 3,199 | 3,926 | 2,959 | 3,290 | 3,290 | 3,873 | 2,742 |
| 2023 | 3,618 | 3,209 | 3,820 | 3,589 | 3,298 | 2,498 | 2,577 | 2,882 | 2,821 | 2,901 | 3,702 | 3,951 |
| 2024 | 3,991 | |||||||||||
| - = No Data Reported; -- = Not Applicable; NA = Not Available; W = Withheld to avoid disclosure of individual company data. |
| Release Date: 3/29/2024 |
| Next Release Date: 4/30/2024 |