|
Download Data (XLS File) |
|
||||||||
|
||||||||
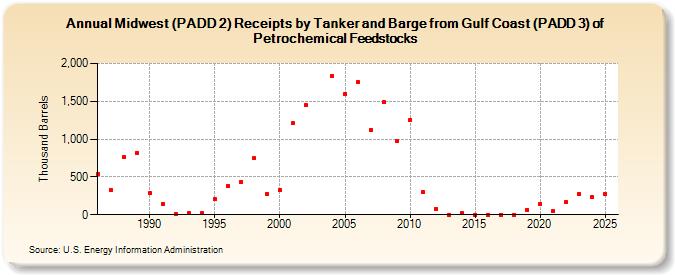
| Midwest (PADD 2) Receipts by Tanker and Barge from Gulf Coast (PADD 3) of Petrochemical Feedstocks (Thousand Barrels) | ||||||||
| Decade | Year-0 | Year-1 | Year-2 | Year-3 | Year-4 | Year-5 | Year-6 | Year-7 | Year-8 | Year-9 |
|---|---|---|---|---|---|---|---|---|---|---|
| 1980's | 543 | 328 | 761 | 822 | ||||||
| 1990's | 285 | 147 | 9 | 20 | 20 | 203 | 378 | 436 | 745 | 271 |
| 2000's | 325 | 1,207 | 1,450 | 1,829 | 1,594 | 1,755 | 1,122 | 1,486 | 977 | |
| 2010's | 1,254 | 299 | 82 | 0 | 23 | 0 | 0 | 0 | 0 | 67 |
| 2020's | 139 | 46 | 171 | 276 |
| - = No Data Reported; -- = Not Applicable; NA = Not Available; W = Withheld to avoid disclosure of individual company data. |
| Release Date: 3/29/2024 |
| Next Release Date: 8/30/2024 |