|
Download Data (XLS File) |
|
||||||||
|
||||||||
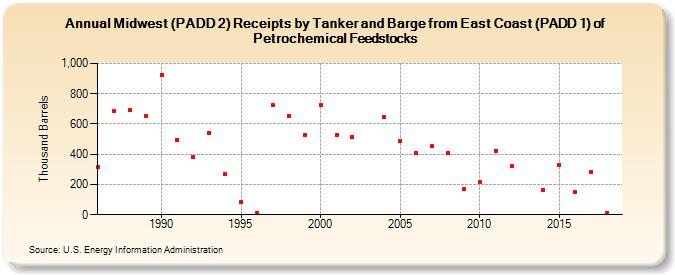
| Midwest (PADD 2) Receipts by Tanker and Barge from East Coast (PADD 1) of Petrochemical Feedstocks (Thousand Barrels) | ||||||||
| Decade | Year-0 | Year-1 | Year-2 | Year-3 | Year-4 | Year-5 | Year-6 | Year-7 | Year-8 | Year-9 |
|---|---|---|---|---|---|---|---|---|---|---|
| 1980's | 317 | 683 | 694 | 651 | ||||||
| 1990's | 927 | 497 | 379 | 538 | 268 | 83 | 12 | 724 | 654 | 528 |
| 2000's | 726 | 527 | 516 | 646 | 489 | 411 | 452 | 407 | 169 | |
| 2010's | 218 | 424 | 319 | 164 | 331 | 151 | 280 | 9 |
| - = No Data Reported; -- = Not Applicable; NA = Not Available; W = Withheld to avoid disclosure of individual company data. |
| Release Date: 4/30/2024 |
| Next Release Date: 8/30/2024 |