|
Download Data (XLS File) |
|
||||||||
|
||||||||
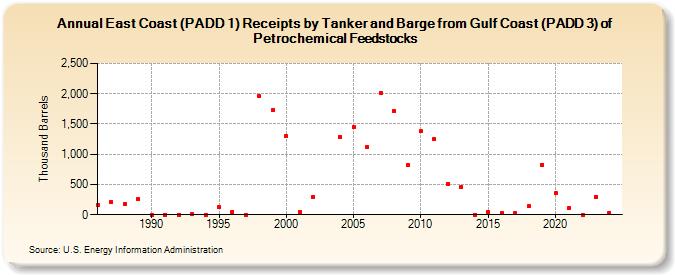
| East Coast (PADD 1) Receipts by Tanker and Barge from Gulf Coast (PADD 3) of Petrochemical Feedstocks (Thousand Barrels) | ||||||||
| Decade | Year-0 | Year-1 | Year-2 | Year-3 | Year-4 | Year-5 | Year-6 | Year-7 | Year-8 | Year-9 |
|---|---|---|---|---|---|---|---|---|---|---|
| 1980's | 164 | 214 | 185 | 263 | ||||||
| 1990's | 0 | 0 | 0 | 10 | 0 | 127 | 50 | 0 | 1,957 | 1,735 |
| 2000's | 1,296 | 53 | 299 | 1,289 | 1,453 | 1,116 | 2,018 | 1,715 | 816 | |
| 2010's | 1,377 | 1,248 | 509 | 455 | 0 | 48 | 36 | 36 | 144 | 828 |
| 2020's | 354 | 111 | 0 | 300 |
| - = No Data Reported; -- = Not Applicable; NA = Not Available; W = Withheld to avoid disclosure of individual company data. |
| Release Date: 8/30/2024 |
| Next Release Date: 8/29/2025 |