|
Download Data (XLS File) |
|
||||||||
|
||||||||
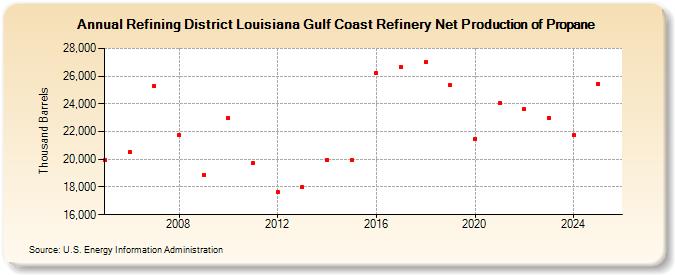
| Refining District Louisiana Gulf Coast Refinery Net Production of Propane (Thousand Barrels) | ||||||||
| Decade | Year-0 | Year-1 | Year-2 | Year-3 | Year-4 | Year-5 | Year-6 | Year-7 | Year-8 | Year-9 |
|---|---|---|---|---|---|---|---|---|---|---|
| 2000's | 19,915 | 20,533 | 25,277 | 21,734 | 18,887 | |||||
| 2010's | 22,999 | 19,749 | 17,621 | 17,968 | 19,950 | 19,914 | 26,191 | 26,644 | 27,021 | 25,338 |
| 2020's | 21,477 | 24,032 | 23,621 | 22,976 |
| - = No Data Reported; -- = Not Applicable; NA = Not Available; W = Withheld to avoid disclosure of individual company data. |
| Release Date: 6/28/2024 |
| Next Release Date: 8/30/2024 |