|
Download Data (XLS File) |
|
||||||||
|
||||||||
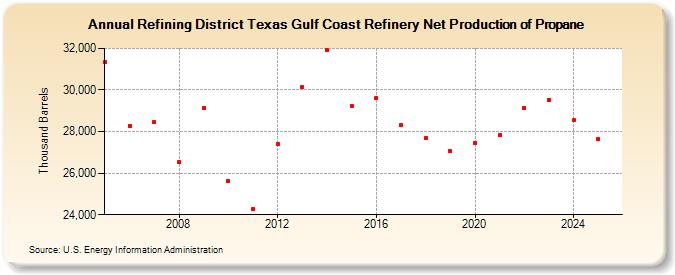
| Refining District Texas Gulf Coast Refinery Net Production of Propane (Thousand Barrels) | ||||||||
| Decade | Year-0 | Year-1 | Year-2 | Year-3 | Year-4 | Year-5 | Year-6 | Year-7 | Year-8 | Year-9 |
|---|---|---|---|---|---|---|---|---|---|---|
| 2000's | 31,334 | 28,279 | 28,458 | 26,530 | 29,133 | |||||
| 2010's | 25,610 | 24,280 | 27,422 | 30,130 | 31,906 | 29,247 | 29,632 | 28,297 | 27,679 | 27,043 |
| 2020's | 27,459 | 27,825 | 29,136 | 29,611 |
| - = No Data Reported; -- = Not Applicable; NA = Not Available; W = Withheld to avoid disclosure of individual company data. |
| Release Date: 3/29/2024 |
| Next Release Date: 8/30/2024 |