|
Download Data (XLS File) |
|
||||||||
|
||||||||
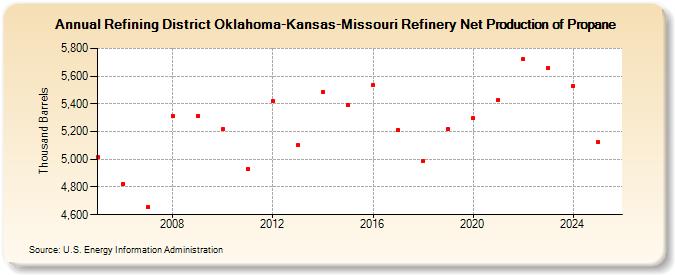
| Refining District Oklahoma-Kansas-Missouri Refinery Net Production of Propane (Thousand Barrels) | ||||||||
| Decade | Year-0 | Year-1 | Year-2 | Year-3 | Year-4 | Year-5 | Year-6 | Year-7 | Year-8 | Year-9 |
|---|---|---|---|---|---|---|---|---|---|---|
| 2000's | 5,013 | 4,822 | 4,655 | 5,314 | 5,315 | |||||
| 2010's | 5,218 | 4,932 | 5,419 | 5,100 | 5,487 | 5,395 | 5,533 | 5,212 | 4,990 | 5,216 |
| 2020's | 5,297 | 5,429 | 5,722 | 5,661 |
| - = No Data Reported; -- = Not Applicable; NA = Not Available; W = Withheld to avoid disclosure of individual company data. |
| Release Date: 3/29/2024 |
| Next Release Date: 8/30/2024 |