|
Download Data (XLS File) |
|
||||||||
|
||||||||
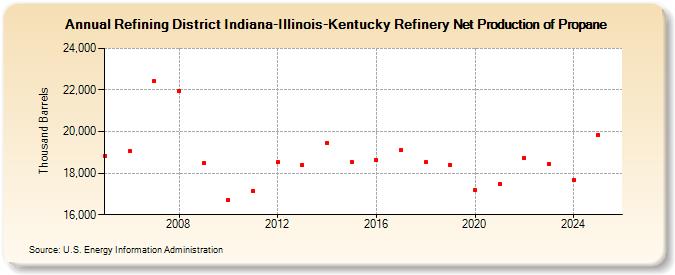
| Refining District Indiana-Illinois-Kentucky Refinery Net Production of Propane (Thousand Barrels) | ||||||||
| Decade | Year-0 | Year-1 | Year-2 | Year-3 | Year-4 | Year-5 | Year-6 | Year-7 | Year-8 | Year-9 |
|---|---|---|---|---|---|---|---|---|---|---|
| 2000's | 18,826 | 19,044 | 22,408 | 21,973 | 18,493 | |||||
| 2010's | 16,725 | 17,143 | 18,515 | 18,387 | 19,462 | 18,545 | 18,627 | 19,116 | 18,523 | 18,399 |
| 2020's | 17,176 | 17,488 | 18,740 | 18,447 |
| - = No Data Reported; -- = Not Applicable; NA = Not Available; W = Withheld to avoid disclosure of individual company data. |
| Release Date: 3/29/2024 |
| Next Release Date: 8/30/2024 |