|
Download Data (XLS File) |
|
||||||||
|
||||||||
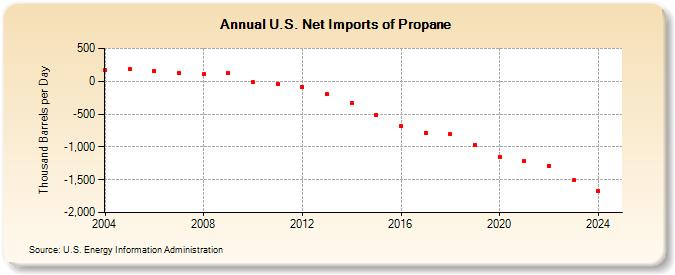
| U.S. Net Imports of Propane (Thousand Barrels per Day) | ||||||||
| Decade | Year-0 | Year-1 | Year-2 | Year-3 | Year-4 | Year-5 | Year-6 | Year-7 | Year-8 | Year-9 |
|---|---|---|---|---|---|---|---|---|---|---|
| 2000's | 170 | 181 | 156 | 120 | 109 | 126 | ||||
| 2010's | -17 | -42 | -86 | -199 | -334 | -511 | -679 | -781 | -810 | -965 |
| 2020's | -1,149 | -1,213 | -1,284 | -1,488 |
| - = No Data Reported; -- = Not Applicable; NA = Not Available; W = Withheld to avoid disclosure of individual company data. |
| Release Date: 4/30/2024 |
| Next Release Date: 8/30/2024 |