|
Download Data (XLS File) |
|
||||||||
|
||||||||
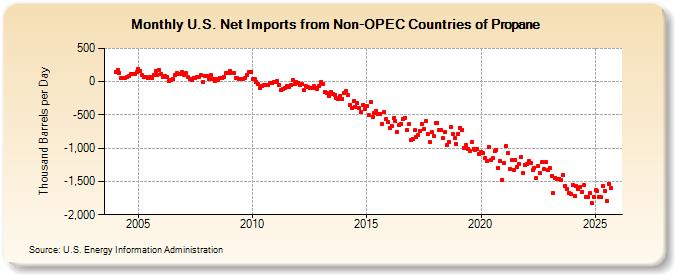
| U.S. Net Imports from Non-OPEC Countries of Propane (Thousand Barrels per Day) | ||||||||
| Year | Jan | Feb | Mar | Apr | May | Jun | Jul | Aug | Sep | Oct | Nov | Dec |
|---|---|---|---|---|---|---|---|---|---|---|---|---|
| 2004 | 145 | 178 | 132 | 55 | 49 | 52 | 64 | 78 | 116 | 113 | 120 | 145 |
| 2005 | 188 | 158 | 93 | 69 | 67 | 51 | 67 | 58 | 106 | 158 | 98 | 175 |
| 2006 | 116 | 75 | 87 | 72 | 12 | 26 | 42 | 106 | 127 | 108 | 113 | 146 |
| 2007 | 98 | 125 | 66 | 41 | 25 | 57 | 59 | 72 | 71 | 96 | -3 | 91 |
| 2008 | 80 | 47 | 99 | 40 | 13 | 43 | 30 | 49 | 54 | 74 | 128 | 127 |
| 2009 | 161 | 125 | 136 | 56 | 51 | 47 | 46 | 39 | 56 | 103 | 147 | 140 |
| 2010 | 40 | 35 | 0 | -41 | -95 | -59 | -54 | -48 | -51 | -13 | -21 | -4 |
| 2011 | -4 | 11 | -53 | -126 | -110 | -96 | -69 | -74 | -50 | 32 | -33 | -8 |
| 2012 | -19 | -49 | -36 | -132 | -72 | -76 | -92 | -89 | -68 | -101 | -103 | -64 |
| 2013 | -5 | -31 | -155 | -172 | -218 | -159 | -184 | -196 | -252 | -255 | -213 | -254 |
| 2014 | -168 | -133 | -206 | -344 | -393 | -298 | -377 | -325 | -402 | -453 | -351 | -408 |
| 2015 | -364 | -505 | -312 | -526 | -477 | -434 | -481 | -482 | -635 | -462 | -566 | -603 |
| 2016 | -692 | -665 | -548 | -594 | -752 | -657 | -636 | -560 | -540 | -733 | -638 | -884 |
| 2017 | -863 | -731 | -833 | -802 | -736 | -637 | -708 | -596 | -782 | -907 | -756 | -815 |
| 2018 | -622 | -617 | -727 | -722 | -854 | -761 | -946 | -909 | -675 | -782 | -852 | -944 |
| 2019 | -782 | -692 | -723 | -1,001 | -953 | -1,008 | -1,039 | -906 | -1,005 | -1,022 | -1,012 | -1,082 |
| 2020 | -1,052 | -1,074 | -1,148 | -1,188 | -980 | -1,171 | -1,153 | -1,048 | -1,027 | -1,300 | -1,196 | -1,472 |
| 2021 | -1,217 | -969 | -1,078 | -1,316 | -1,184 | -1,326 | -1,178 | -1,289 | -1,237 | -1,136 | -1,380 | -1,255 |
| 2022 | -1,242 | -1,191 | -1,225 | -1,332 | -1,297 | -1,449 | -1,267 | -1,369 | -1,209 | -1,320 | -1,205 | -1,332 |
| 2023 | -1,301 | -1,390 | -1,567 | -1,387 | -1,415 | -1,432 | -1,479 | -1,385 | -1,534 | -1,596 | -1,694 | -1,737 |
| 2024 | -1,569 | |||||||||||
| - = No Data Reported; -- = Not Applicable; NA = Not Available; W = Withheld to avoid disclosure of individual company data. |
| Release Date: 3/29/2024 |
| Next Release Date: 4/30/2024 |