|
Download Data (XLS File) |
|
||||||||
|
||||||||
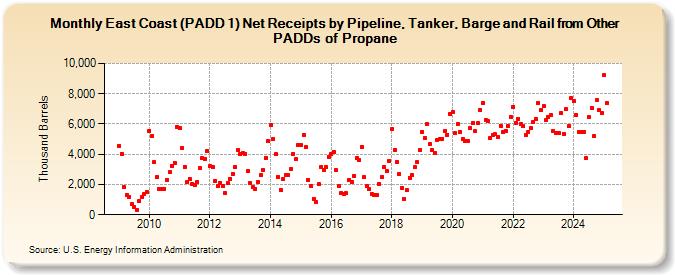
| East Coast (PADD 1) Net Receipts by Pipeline, Tanker, Barge and Rail from Other PADDs of Propane (Thousand Barrels) | ||||||||
| Year | Jan | Feb | Mar | Apr | May | Jun | Jul | Aug | Sep | Oct | Nov | Dec |
|---|---|---|---|---|---|---|---|---|---|---|---|---|
| 2009 | 4,554 | 4,040 | 1,836 | 1,303 | 1,184 | 699 | 540 | 334 | 903 | 1,142 | 1,380 | 1,500 |
| 2010 | 5,566 | 5,215 | 3,470 | 2,482 | 1,731 | 1,722 | 1,726 | 2,328 | 2,794 | 3,214 | 3,448 | 5,803 |
| 2011 | 5,747 | 4,417 | 3,162 | 2,151 | 2,364 | 2,061 | 1,947 | 2,163 | 3,057 | 3,741 | 3,698 | 4,184 |
| 2012 | 3,217 | 3,136 | 2,258 | 1,887 | 2,117 | 1,882 | 1,435 | 2,087 | 2,366 | 2,718 | 3,161 | 4,312 |
| 2013 | 4,019 | 4,064 | 4,042 | 2,867 | 2,095 | 1,844 | 1,732 | 2,168 | 2,596 | 2,964 | 3,778 | 4,878 |
| 2014 | 5,910 | 5,015 | 3,993 | 2,525 | 1,661 | 2,370 | 2,629 | 2,594 | 3,049 | 4,028 | 3,666 | 4,598 |
| 2015 | 4,585 | 5,277 | 4,472 | 2,293 | 1,877 | 1,069 | 872 | 2,001 | 3,155 | 2,986 | 3,129 | 3,845 |
| 2016 | 4,027 | 4,175 | 2,949 | 1,880 | 1,434 | 1,375 | 1,423 | 2,303 | 2,170 | 2,587 | 3,743 | 3,635 |
| 2017 | 4,487 | 2,464 | 1,889 | 1,671 | 1,397 | 1,305 | 1,311 | 2,060 | 2,513 | 3,166 | 2,886 | 3,556 |
| 2018 | 5,676 | 4,290 | 3,518 | 2,702 | 1,780 | 1,069 | 1,614 | 2,453 | 2,607 | 3,142 | 3,479 | 4,269 |
| 2019 | 5,487 | 5,099 | 5,987 | 4,663 | 4,277 | 4,077 | 4,962 | 4,975 | 5,012 | 5,536 | 5,304 | 6,691 |
| 2020 | 6,776 | 5,385 | 6,007 | 5,494 | 5,016 | 4,869 | 4,898 | 5,734 | 6,065 | 5,517 | 6,033 | 6,929 |
| 2021 | 7,395 | 6,271 | 6,221 | 5,075 | 5,296 | 5,310 | 5,149 | 5,891 | 5,443 | 5,553 | 5,883 | 6,487 |
| 2022 | 7,136 | 6,092 | 6,358 | 5,996 | 5,843 | 5,252 | 5,492 | 5,706 | 6,109 | 6,327 | 7,391 | 6,910 |
| 2023 | 7,109 | 6,261 | 4,537 | 5,410 | 5,512 | 5,407 | 5,428 | 6,709 | 5,358 | 6,975 | 5,829 | 6,538 |
| 2024 | 7,643 | |||||||||||
| - = No Data Reported; -- = Not Applicable; NA = Not Available; W = Withheld to avoid disclosure of individual company data. |
| Release Date: 3/29/2024 |
| Next Release Date: 4/30/2024 |