|
Download Data (XLS File) |
|
||||||||
|
||||||||
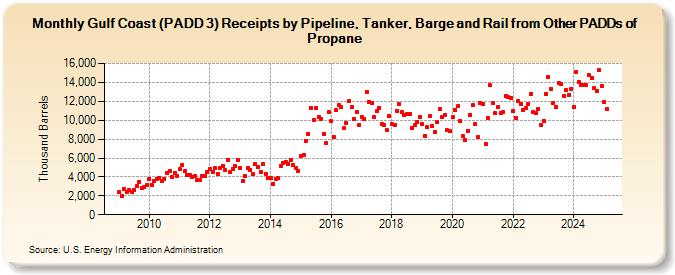
| Gulf Coast (PADD 3) Receipts by Pipeline, Tanker, Barge and Rail from Other PADDs of Propane (Thousand Barrels) | ||||||||
| Year | Jan | Feb | Mar | Apr | May | Jun | Jul | Aug | Sep | Oct | Nov | Dec |
|---|---|---|---|---|---|---|---|---|---|---|---|---|
| 2009 | 2,422 | 1,998 | 2,732 | 2,356 | 2,613 | 2,403 | 2,593 | 3,036 | 3,484 | 2,784 | 2,912 | 3,131 |
| 2010 | 3,827 | 3,167 | 3,591 | 3,822 | 3,932 | 3,571 | 3,791 | 4,436 | 4,580 | 4,023 | 4,414 | 4,141 |
| 2011 | 4,829 | 5,241 | 4,597 | 4,167 | 4,246 | 3,951 | 4,088 | 3,692 | 3,716 | 4,139 | 4,079 | 4,505 |
| 2012 | 4,785 | 4,504 | 4,910 | 4,322 | 4,983 | 5,194 | 4,720 | 5,816 | 4,567 | 4,853 | 5,187 | 5,816 |
| 2013 | 4,947 | 3,552 | 4,088 | 4,937 | 4,724 | 4,296 | 5,350 | 5,053 | 4,533 | 5,318 | 4,360 | 3,880 |
| 2014 | 3,860 | 3,280 | 3,801 | 3,841 | 5,164 | 5,424 | 5,593 | 5,403 | 5,779 | 5,212 | 4,957 | 4,618 |
| 2015 | 6,244 | 6,358 | 7,773 | 8,573 | 11,267 | 9,983 | 11,282 | 10,354 | 10,130 | 8,547 | 7,552 | 10,833 |
| 2016 | 9,902 | 8,243 | 11,087 | 11,563 | 11,432 | 9,169 | 9,741 | 11,984 | 11,349 | 10,141 | 10,899 | 9,519 |
| 2017 | 10,325 | 10,174 | 12,958 | 11,975 | 11,864 | 10,336 | 10,926 | 11,318 | 9,609 | 9,445 | 8,954 | 10,485 |
| 2018 | 9,567 | 9,512 | 11,007 | 11,738 | 10,831 | 10,545 | 10,633 | 10,628 | 9,142 | 9,465 | 9,860 | 10,334 |
| 2019 | 9,591 | 8,318 | 9,237 | 10,414 | 9,354 | 8,782 | 9,773 | 11,211 | 10,314 | 10,590 | 8,931 | 8,829 |
| 2020 | 10,333 | 11,028 | 11,470 | 9,936 | 8,291 | 7,930 | 8,880 | 10,553 | 11,603 | 9,564 | 8,202 | 11,790 |
| 2021 | 11,735 | 7,452 | 10,269 | 13,685 | 11,816 | 10,740 | 11,412 | 10,739 | 10,836 | 12,573 | 12,451 | 12,350 |
| 2022 | 10,956 | 10,275 | 11,989 | 11,695 | 11,053 | 11,257 | 11,693 | 12,785 | 10,859 | 10,745 | 11,213 | 9,461 |
| 2023 | 9,932 | 12,806 | 14,576 | 13,331 | 11,823 | 11,377 | 13,958 | 13,865 | 12,597 | 13,145 | 12,679 | 13,336 |
| 2024 | 11,386 | 15,100 | 14,002 | 13,752 | ||||||||
| - = No Data Reported; -- = Not Applicable; NA = Not Available; W = Withheld to avoid disclosure of individual company data. |
| Release Date: 6/28/2024 |
| Next Release Date: 7/31/2024 |