|
Download Data (XLS File) |
|
||||||||
|
||||||||
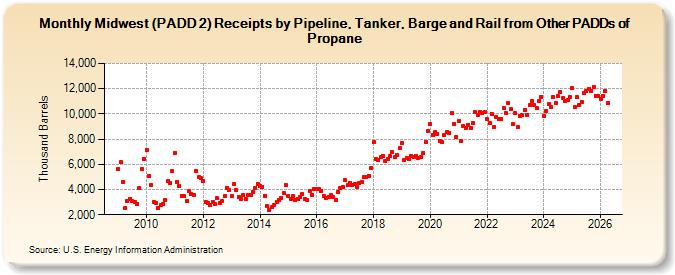
| Midwest (PADD 2) Receipts by Pipeline, Tanker, Barge and Rail from Other PADDs of Propane (Thousand Barrels) | ||||||||
| Year | Jan | Feb | Mar | Apr | May | Jun | Jul | Aug | Sep | Oct | Nov | Dec |
|---|---|---|---|---|---|---|---|---|---|---|---|---|
| 2009 | 5,658 | 6,155 | 4,571 | 2,565 | 3,126 | 3,267 | 3,060 | 3,001 | 2,878 | 4,133 | 5,604 | 6,419 |
| 2010 | 7,150 | 5,110 | 4,378 | 3,019 | 2,950 | 2,555 | 2,745 | 2,860 | 3,140 | 4,677 | 4,484 | 5,430 |
| 2011 | 6,920 | 4,607 | 4,270 | 3,483 | 3,448 | 3,080 | 3,855 | 3,613 | 3,555 | 5,449 | 4,959 | 4,885 |
| 2012 | 4,667 | 3,017 | 2,955 | 2,754 | 3,021 | 2,859 | 3,289 | 2,948 | 3,072 | 3,459 | 4,142 | 3,956 |
| 2013 | 3,497 | 4,399 | 3,954 | 3,413 | 3,238 | 3,595 | 3,256 | 3,538 | 3,553 | 3,810 | 4,156 | 4,462 |
| 2014 | 4,267 | 4,237 | 3,511 | 2,676 | 2,395 | 2,574 | 2,810 | 3,036 | 3,168 | 3,346 | 3,684 | 4,351 |
| 2015 | 3,488 | 3,221 | 3,461 | 3,167 | 3,252 | 3,371 | 3,634 | 3,238 | 3,163 | 3,847 | 3,602 | 4,052 |
| 2016 | 4,059 | 4,019 | 3,876 | 3,514 | 3,360 | 3,414 | 3,562 | 3,377 | 3,203 | 3,774 | 4,151 | 4,218 |
| 2017 | 4,738 | 4,345 | 4,538 | 4,370 | 4,411 | 4,209 | 4,549 | 4,582 | 5,023 | 5,027 | 5,101 | 5,739 |
| 2018 | 7,748 | 6,387 | 6,350 | 6,544 | 6,691 | 6,295 | 6,412 | 6,625 | 6,941 | 6,557 | 6,748 | 7,257 |
| 2019 | 7,674 | 6,334 | 6,461 | 6,456 | 6,620 | 6,600 | 6,656 | 6,503 | 6,614 | 6,915 | 7,753 | 8,606 |
| 2020 | 9,188 | 8,348 | 8,550 | 8,443 | 7,867 | 7,745 | 8,362 | 8,567 | 8,487 | 10,067 | 9,206 | 8,181 |
| 2021 | 9,429 | 7,856 | 9,025 | 8,862 | 9,129 | 8,853 | 9,283 | 10,154 | 9,892 | 10,157 | 10,071 | 10,115 |
| 2022 | 9,596 | 9,314 | 10,020 | 8,978 | 9,753 | 9,620 | 9,597 | 10,435 | 10,107 | 10,865 | 10,363 | 9,169 |
| 2023 | 10,112 | 8,974 | 9,849 | 9,906 | 10,326 | 9,910 | 10,719 | 11,018 | 10,680 | 10,430 | 11,011 | 11,380 |
| 2024 | 9,888 | |||||||||||
| - = No Data Reported; -- = Not Applicable; NA = Not Available; W = Withheld to avoid disclosure of individual company data. |
| Release Date: 3/29/2024 |
| Next Release Date: 4/30/2024 |