|
Download Data (XLS File) |
|
||||||||
|
||||||||
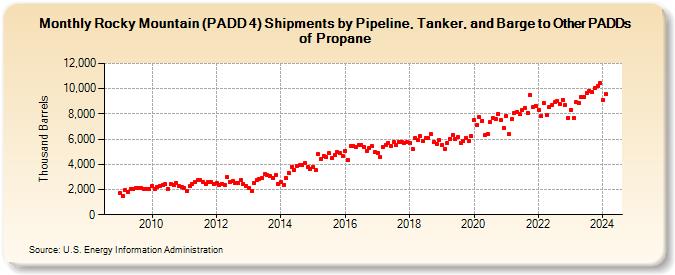
| Rocky Mountain (PADD 4) Shipments by Pipeline, Tanker, and Barge to Other PADDs of Propane (Thousand Barrels) | ||||||||
| Year | Jan | Feb | Mar | Apr | May | Jun | Jul | Aug | Sep | Oct | Nov | Dec |
|---|---|---|---|---|---|---|---|---|---|---|---|---|
| 2009 | 1,718 | 1,494 | 1,946 | 1,804 | 2,042 | 2,043 | 2,099 | 2,106 | 2,103 | 2,024 | 2,032 | 2,031 |
| 2010 | 2,318 | 2,034 | 2,161 | 2,300 | 2,392 | 2,409 | 2,077 | 2,399 | 2,329 | 2,548 | 2,243 | 2,188 |
| 2011 | 2,128 | 1,857 | 2,260 | 2,435 | 2,563 | 2,726 | 2,728 | 2,609 | 2,429 | 2,558 | 2,596 | 2,431 |
| 2012 | 2,511 | 2,392 | 2,458 | 2,393 | 2,977 | 2,622 | 2,646 | 2,498 | 2,524 | 2,741 | 2,467 | 2,304 |
| 2013 | 2,109 | 1,867 | 2,498 | 2,758 | 2,871 | 2,944 | 3,218 | 3,146 | 3,038 | 2,892 | 3,112 | 2,457 |
| 2014 | 2,578 | 2,365 | 2,886 | 3,311 | 3,810 | 3,587 | 3,869 | 3,927 | 3,957 | 4,088 | 3,817 | 3,629 |
| 2015 | 3,778 | 3,516 | 4,784 | 4,409 | 4,694 | 4,541 | 4,869 | 4,464 | 4,715 | 4,959 | 4,902 | 4,696 |
| 2016 | 5,081 | 4,333 | 5,459 | 5,454 | 5,346 | 5,549 | 5,535 | 5,356 | 5,071 | 5,285 | 5,418 | 4,993 |
| 2017 | 4,923 | 4,616 | 5,377 | 5,536 | 5,694 | 5,455 | 5,740 | 5,550 | 5,792 | 5,776 | 5,686 | 5,766 |
| 2018 | 5,710 | 5,210 | 6,057 | 5,962 | 6,213 | 5,815 | 6,092 | 6,073 | 6,387 | 5,737 | 5,644 | 5,930 |
| 2019 | 5,537 | 5,193 | 5,695 | 6,027 | 6,331 | 5,975 | 6,132 | 5,706 | 5,827 | 6,120 | 5,878 | 6,227 |
| 2020 | 7,484 | 7,096 | 7,717 | 7,443 | 6,300 | 6,424 | 7,339 | 7,690 | 7,613 | 7,996 | 7,493 | 6,873 |
| 2021 | 7,834 | 6,413 | 7,560 | 8,072 | 8,177 | 7,970 | 8,292 | 8,471 | 8,104 | 9,493 | 8,521 | 8,641 |
| 2022 | 8,337 | 7,808 | 8,871 | 7,897 | 8,526 | 8,715 | 8,909 | 9,000 | 8,758 | 9,142 | 8,697 | 7,713 |
| 2023 | 8,300 | 7,702 | 8,913 | 8,895 | 9,335 | 9,367 | 9,672 | 9,834 | 9,709 | 10,047 | 10,232 | 10,416 |
| 2024 | 9,080 | |||||||||||
| - = No Data Reported; -- = Not Applicable; NA = Not Available; W = Withheld to avoid disclosure of individual company data. |
| Release Date: 3/29/2024 |
| Next Release Date: 4/30/2024 |