|
Download Data (XLS File) |
|
||||||||
|
||||||||
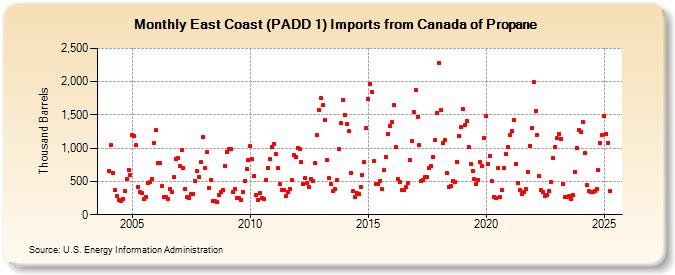
| East Coast (PADD 1) Imports from Canada of Propane (Thousand Barrels) | ||||||||
| Year | Jan | Feb | Mar | Apr | May | Jun | Jul | Aug | Sep | Oct | Nov | Dec |
|---|---|---|---|---|---|---|---|---|---|---|---|---|
| 2004 | 660 | 1,049 | 634 | 364 | 283 | 214 | 205 | 233 | 363 | 534 | 677 | 591 |
| 2005 | 1,204 | 1,185 | 1,042 | 411 | 334 | 324 | 239 | 270 | 471 | 488 | 536 | 1,080 |
| 2006 | 1,269 | 778 | 781 | 435 | 259 | 260 | 242 | 387 | 341 | 561 | 837 | 850 |
| 2007 | 730 | 971 | 707 | 384 | 259 | 256 | 305 | 308 | 502 | 654 | 570 | 791 |
| 2008 | 1,169 | 697 | 947 | 406 | 529 | 213 | 213 | 187 | 303 | 348 | 378 | 737 |
| 2009 | 950 | 987 | 993 | 335 | 386 | 247 | 254 | 222 | 346 | 511 | 684 | 818 |
| 2010 | 1,040 | 831 | 583 | 303 | 214 | 323 | 253 | 239 | 522 | 707 | 832 | 1,019 |
| 2011 | 1,065 | 916 | 699 | 457 | 376 | 378 | 277 | 346 | 387 | 517 | 893 | 861 |
| 2012 | 1,008 | 991 | 791 | 469 | 549 | 480 | 423 | 537 | 514 | 780 | 1,193 | 1,578 |
| 2013 | 1,748 | 1,655 | 1,417 | 819 | 546 | 455 | 352 | 387 | 515 | 981 | 1,373 | 1,726 |
| 2014 | 1,499 | 1,366 | 1,251 | 633 | 350 | 272 | 331 | 307 | 420 | 603 | 788 | 1,307 |
| 2015 | 1,732 | 1,959 | 1,850 | 803 | 462 | 459 | 512 | 380 | 678 | 871 | 1,212 | 1,326 |
| 2016 | 1,387 | 1,648 | 1,021 | 538 | 492 | 376 | 375 | 410 | 471 | 828 | 1,111 | 1,551 |
| 2017 | 1,879 | 1,475 | 1,050 | 513 | 517 | 561 | 569 | 698 | 739 | 873 | 1,120 | 1,526 |
| 2018 | 2,286 | 1,581 | 1,075 | 1,122 | 622 | 413 | 430 | 509 | 498 | 799 | 1,190 | 1,312 |
| 2019 | 1,584 | 1,346 | 1,408 | 1,023 | 758 | 650 | 535 | 465 | 517 | 791 | 732 | 1,158 |
| 2020 | 1,480 | 758 | 879 | 500 | 268 | 247 | 707 | 264 | 369 | 702 | 917 | 1,016 |
| 2021 | 1,198 | 1,255 | 1,419 | 766 | 475 | 377 | 317 | 340 | 390 | 646 | 1,040 | 1,302 |
| 2022 | 1,989 | 1,554 | 1,201 | 579 | 368 | 335 | 279 | 301 | 357 | 489 | 848 | 1,020 |
| 2023 | 1,118 | 1,175 | 1,117 | 454 | 257 | 252 | 268 | 237 | 289 | 650 | 1,010 | 1,267 |
| 2024 | 1,238 | |||||||||||
| - = No Data Reported; -- = Not Applicable; NA = Not Available; W = Withheld to avoid disclosure of individual company data. |
| Release Date: 3/29/2024 |
| Next Release Date: 4/30/2024 |