|
Download Data (XLS File) |
|
||||||||
|
||||||||
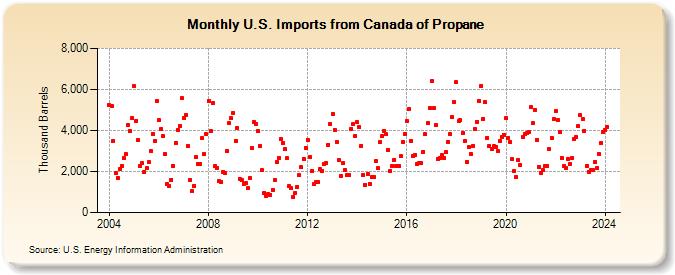
| U.S. Imports from Canada of Propane (Thousand Barrels) | ||||||||
| Year | Jan | Feb | Mar | Apr | May | Jun | Jul | Aug | Sep | Oct | Nov | Dec |
|---|---|---|---|---|---|---|---|---|---|---|---|---|
| 2004 | 5,221 | 5,210 | 3,479 | 1,924 | 1,699 | 2,116 | 2,272 | 2,643 | 2,834 | 4,253 | 3,984 | 4,608 |
| 2005 | 6,147 | 4,483 | 3,524 | 2,271 | 2,396 | 1,991 | 2,158 | 2,443 | 2,995 | 3,846 | 3,504 | 5,426 |
| 2006 | 4,489 | 4,063 | 3,711 | 2,831 | 1,398 | 1,282 | 1,608 | 2,261 | 3,399 | 4,032 | 4,217 | 5,561 |
| 2007 | 4,626 | 4,765 | 3,261 | 1,599 | 1,037 | 1,307 | 2,706 | 2,358 | 2,357 | 3,617 | 2,833 | 3,812 |
| 2008 | 5,431 | 3,974 | 5,323 | 2,256 | 2,171 | 1,523 | 1,484 | 1,992 | 1,926 | 3,009 | 4,341 | 4,598 |
| 2009 | 4,869 | 3,504 | 4,130 | 1,642 | 1,578 | 1,411 | 1,421 | 1,178 | 1,692 | 3,164 | 4,408 | 4,328 |
| 2010 | 3,968 | 3,232 | 2,057 | 972 | 821 | 925 | 868 | 1,103 | 1,599 | 2,455 | 2,670 | 3,583 |
| 2011 | 3,396 | 3,082 | 2,635 | 1,270 | 1,174 | 780 | 966 | 1,253 | 1,811 | 2,206 | 2,615 | 3,163 |
| 2012 | 3,557 | 2,719 | 2,049 | 1,388 | 1,470 | 1,501 | 2,118 | 2,028 | 2,363 | 2,413 | 3,316 | 4,327 |
| 2013 | 4,801 | 4,043 | 3,456 | 2,540 | 1,768 | 2,419 | 2,066 | 1,835 | 1,824 | 4,092 | 4,300 | 3,723 |
| 2014 | 4,400 | 4,168 | 3,245 | 1,820 | 1,350 | 1,889 | 1,398 | 1,732 | 1,743 | 2,502 | 2,154 | 3,416 |
| 2015 | 3,734 | 3,957 | 3,808 | 3,056 | 2,031 | 2,276 | 2,581 | 2,284 | 2,261 | 2,735 | 3,422 | 3,839 |
| 2016 | 4,457 | 5,025 | 3,511 | 2,769 | 2,818 | 2,360 | 2,404 | 2,399 | 2,971 | 3,804 | 4,359 | 5,084 |
| 2017 | 6,418 | 5,077 | 4,266 | 2,625 | 2,680 | 2,781 | 2,666 | 2,951 | 3,459 | 3,807 | 4,653 | 5,394 |
| 2018 | 6,348 | 4,441 | 4,510 | 3,876 | 3,474 | 2,487 | 3,178 | 2,843 | 3,244 | 4,060 | 4,434 | 5,447 |
| 2019 | 6,156 | 4,573 | 5,370 | 3,647 | 3,236 | 3,092 | 3,224 | 3,204 | 2,991 | 3,494 | 3,678 | 3,799 |
| 2020 | 4,585 | 3,649 | 3,433 | 2,589 | 2,007 | 1,737 | 2,551 | 2,321 | 3,686 | 3,832 | 3,862 | 3,914 |
| 2021 | 5,122 | 4,344 | 5,012 | 3,559 | 2,231 | 1,937 | 2,051 | 2,279 | 2,279 | 3,084 | 3,655 | 4,547 |
| 2022 | 4,925 | 4,507 | 3,916 | 2,667 | 2,260 | 2,181 | 2,608 | 2,374 | 2,660 | 3,578 | 3,688 | 4,224 |
| 2023 | 4,749 | 4,538 | 3,969 | 2,278 | 1,991 | 2,063 | 2,061 | 2,487 | 2,181 | 2,865 | 3,381 | 3,944 |
| 2024 | 4,038 | |||||||||||
| - = No Data Reported; -- = Not Applicable; NA = Not Available; W = Withheld to avoid disclosure of individual company data. |
| Release Date: 3/29/2024 |
| Next Release Date: 4/30/2024 |
Referring Pages: