|
Download Data (XLS File) |
|
||||||||
|
||||||||
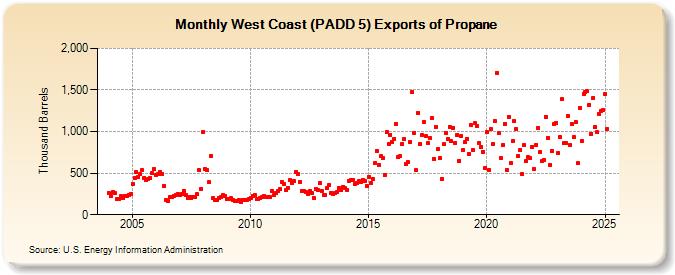
| West Coast (PADD 5) Exports of Propane (Thousand Barrels) | ||||||||
| Year | Jan | Feb | Mar | Apr | May | Jun | Jul | Aug | Sep | Oct | Nov | Dec |
|---|---|---|---|---|---|---|---|---|---|---|---|---|
| 2004 | 264 | 222 | 272 | 259 | 187 | 187 | 221 | 202 | 223 | 221 | 243 | 248 |
| 2005 | 368 | 443 | 511 | 450 | 486 | 532 | 447 | 423 | 434 | 442 | 504 | 548 |
| 2006 | 473 | 485 | 513 | 493 | 351 | 181 | 162 | 212 | 209 | 230 | 233 | 253 |
| 2007 | 242 | 254 | 286 | 242 | 199 | 217 | 195 | 219 | 219 | 246 | 532 | 314 |
| 2008 | 992 | 545 | 534 | 390 | 704 | 200 | 177 | 172 | 200 | 216 | 240 | 220 |
| 2009 | 191 | 190 | 196 | 174 | 165 | 164 | 174 | 155 | 179 | 179 | 175 | 190 |
| 2010 | 196 | 230 | 235 | 185 | 193 | 195 | 208 | 223 | 216 | 215 | 209 | 287 |
| 2011 | 243 | 256 | 282 | 304 | 392 | 365 | 294 | 327 | 417 | 386 | 405 | 517 |
| 2012 | 489 | 397 | 290 | 281 | 272 | 255 | 280 | 259 | 205 | 314 | 294 | 377 |
| 2013 | 288 | 234 | 235 | 323 | 360 | 267 | 249 | 261 | 274 | 321 | 293 | 337 |
| 2014 | 318 | 301 | 411 | 420 | 415 | 367 | 380 | 404 | 395 | 415 | 407 | 345 |
| 2015 | 457 | 376 | 432 | 618 | 767 | 601 | 705 | 685 | 474 | 999 | 849 | 962 |
| 2016 | 876 | 915 | 1,089 | 694 | 701 | 856 | 914 | 614 | 628 | 875 | 1,473 | 988 |
| 2017 | 537 | 1,228 | 849 | 964 | 1,119 | 942 | 859 | 921 | 1,161 | 673 | 1,060 | 788 |
| 2018 | 680 | 433 | 846 | 987 | 910 | 1,059 | 883 | 1,046 | 868 | 962 | 650 | 951 |
| 2019 | 778 | 879 | 916 | 735 | 1,075 | 779 | 1,099 | 1,071 | 862 | 820 | 760 | 566 |
| 2020 | 991 | 539 | 1,032 | 847 | 1,128 | 1,710 | 977 | 677 | 837 | 1,094 | 540 | 1,178 |
| 2021 | 617 | 886 | 1,126 | 1,030 | 708 | 782 | 492 | 836 | 645 | 690 | 681 | 820 |
| 2022 | 551 | 843 | 1,046 | 757 | 640 | 657 | 1,178 | 926 | 602 | 767 | 1,086 | 1,105 |
| 2023 | 743 | 932 | 1,393 | 995 | 721 | 1,189 | 836 | 1,089 | 928 | 1,117 | 615 | 1,287 |
| 2024 | 887 | 1,456 | 1,475 | 1,484 | ||||||||
| - = No Data Reported; -- = Not Applicable; NA = Not Available; W = Withheld to avoid disclosure of individual company data. |
| Release Date: 6/28/2024 |
| Next Release Date: 7/31/2024 |