|
Download Data (XLS File) |
|
||||||||
|
||||||||
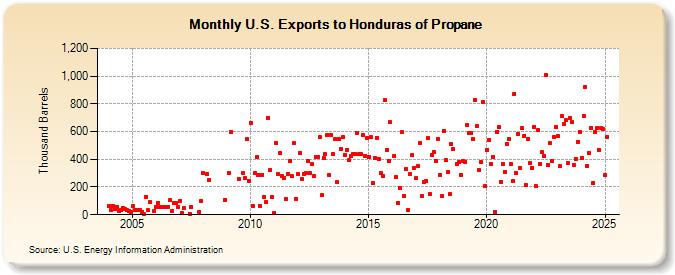
| U.S. Exports to Honduras of Propane (Thousand Barrels) | ||||||||
| Year | Jan | Feb | Mar | Apr | May | Jun | Jul | Aug | Sep | Oct | Nov | Dec |
|---|---|---|---|---|---|---|---|---|---|---|---|---|
| 2004 | 62 | 31 | 66 | 38 | 57 | 26 | 37 | 49 | 40 | 34 | 26 | 22 |
| 2005 | 61 | 32 | 36 | 36 | 31 | 23 | 2 | 131 | 31 | 90 | 29 | |
| 2006 | 58 | 87 | 58 | 58 | 58 | 58 | 58 | 103 | 29 | 87 | 85 | 58 |
| 2007 | 101 | 15 | 46 | 7 | 54 | 18 | 100 | |||||
| 2008 | 298 | 297 | 250 | 109 | ||||||||
| 2009 | 300 | 598 | 258 | 298 | 264 | 545 | 244 | |||||
| 2010 | 661 | 65 | 298 | 415 | 288 | 62 | 289 | 125 | 89 | 699 | 326 | 131 |
| 2011 | 15 | 519 | 291 | 446 | 276 | 267 | 112 | 295 | 386 | 279 | 515 | 115 |
| 2012 | 293 | 446 | 261 | 296 | 299 | 387 | 299 | 365 | 280 | 419 | 418 | 559 |
| 2013 | 141 | 408 | 436 | 578 | 285 | 577 | 437 | 547 | 233 | 543 | 476 | 558 |
| 2014 | 431 | 467 | 393 | 425 | 437 | 436 | 592 | 435 | 435 | 575 | 427 | 553 |
| 2015 | 416 | 562 | 226 | 410 | 557 | 401 | 299 | 282 | 829 | 468 | 387 | 667 |
| 2016 | 427 | 269 | 86 | 192 | 594 | 137 | 331 | 36 | 291 | 428 | 339 | |
| 2017 | 263 | 348 | 514 | 137 | 234 | 240 | 550 | 149 | 432 | 453 | 386 | 549 |
| 2018 | 286 | 135 | 606 | 394 | 310 | 148 | 509 | 473 | 364 | 379 | 285 | |
| 2019 | 391 | 383 | 646 | 586 | 593 | 543 | 828 | 637 | 321 | 381 | 814 | 205 |
| 2020 | 470 | 542 | 363 | 415 | 18 | 598 | 631 | 238 | 365 | 309 | 509 | 546 |
| 2021 | 369 | 241 | 871 | 299 | 583 | 339 | 625 | 571 | 213 | 545 | 372 | 339 |
| 2022 | 634 | 204 | 608 | 368 | 452 | 427 | 1,009 | 360 | 515 | 386 | 562 | 633 |
| 2023 | 595 | 349 | 1,156 | 376 | 684 | 373 | 697 | 670 | 362 | 403 | 527 | 597 |
| 2024 | 409 | |||||||||||
| - = No Data Reported; -- = Not Applicable; NA = Not Available; W = Withheld to avoid disclosure of individual company data. |
| Release Date: 3/29/2024 |
| Next Release Date: 4/30/2024 |