|
Download Data (XLS File) |
|
||||||||
|
||||||||
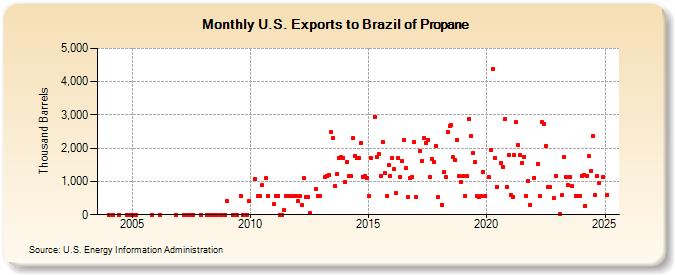
| U.S. Exports to Brazil of Propane (Thousand Barrels) | ||||||||
| Year | Jan | Feb | Mar | Apr | May | Jun | Jul | Aug | Sep | Oct | Nov | Dec |
|---|---|---|---|---|---|---|---|---|---|---|---|---|
| 2004 | 1 | 0 | 0 | 0 | 0 | |||||||
| 2005 | 0 | 0 | 0 | |||||||||
| 2006 | 0 | 2 | ||||||||||
| 2007 | 0 | 0 | 0 | 2 | 0 | |||||||
| 2008 | 0 | 1 | 0 | 0 | 0 | 0 | 0 | |||||
| 2009 | 400 | 0 | 0 | 0 | 568 | 0 | 0 | 410 | ||||
| 2010 | 1,078 | 572 | 550 | 892 | 1,096 | 569 | ||||||
| 2011 | 312 | 572 | 576 | 0 | 0 | 129 | 550 | 567 | 576 | 550 | 575 | |
| 2012 | 410 | 550 | 298 | 1,111 | 546 | 547 | 47 | 774 | 575 | 577 | ||
| 2013 | 1,134 | 1,150 | 1,200 | 2,472 | 2,297 | 857 | 1,237 | 1,705 | 1,722 | 1,717 | ||
| 2014 | 994 | 1,579 | 1,152 | 1,154 | 2,296 | 1,775 | 1,710 | 1,692 | 2,147 | 1,148 | 1,153 | 1,100 |
| 2015 | 550 | 1,719 | 2,950 | 1,731 | 1,821 | 1,157 | 2,190 | 1,243 | 576 | 1,498 | 1,159 | |
| 2016 | 1,703 | 1,361 | 649 | 1,703 | 1,128 | 1,610 | 2,248 | 1,406 | 522 | 1,100 | 1,127 | 2,184 |
| 2017 | 523 | 1,924 | 1,622 | 2,316 | 2,157 | 2,255 | 1,122 | 1,675 | 1,595 | 2,065 | 522 | |
| 2018 | 306 | 1,274 | 1,127 | 2,492 | 2,665 | 2,704 | 1,725 | 1,633 | 2,248 | 1,150 | 989 | |
| 2019 | 1,151 | 560 | 1,159 | 2,889 | 2,361 | 1,847 | 1,577 | 550 | 546 | 568 | 1,297 | 572 |
| 2020 | 1,126 | 1,946 | 4,381 | 1,718 | 838 | 1,567 | 1,428 | 2,869 | 835 | 1,801 | ||
| 2021 | 586 | 547 | 1,799 | 2,778 | 2,090 | 1,783 | 1,561 | 1,735 | 574 | 1,015 | 293 | |
| 2022 | 1,118 | 1,538 | 576 | 2,783 | 2,721 | 2,063 | 833 | 821 | 493 | 1,174 | ||
| 2023 | 21 | 584 | 1,728 | 1,147 | 890 | 1,145 | 854 | 577 | 577 | 577 | ||
| 2024 | 1,157 | |||||||||||
| - = No Data Reported; -- = Not Applicable; NA = Not Available; W = Withheld to avoid disclosure of individual company data. |
| Release Date: 3/29/2024 |
| Next Release Date: 4/30/2024 |