|
Download Data (XLS File) |
|
||||||||
|
||||||||
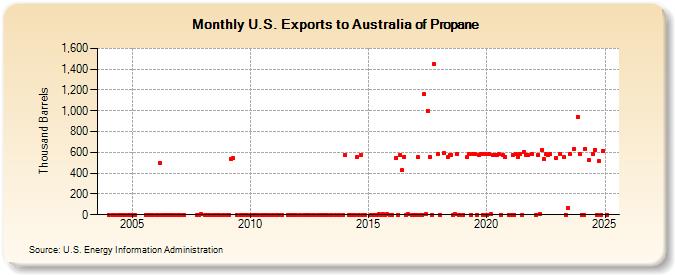
| U.S. Exports to Australia of Propane (Thousand Barrels) | ||||||||
| Year | Jan | Feb | Mar | Apr | May | Jun | Jul | Aug | Sep | Oct | Nov | Dec |
|---|---|---|---|---|---|---|---|---|---|---|---|---|
| 2004 | 0 | 0 | 1 | 1 | 0 | 0 | 0 | 0 | 2 | |||
| 2005 | 0 | 0 | 0 | 0 | 0 | |||||||
| 2006 | 0 | 1 | 497 | 0 | 0 | 1 | 0 | 2 | 1 | 1 | 0 | |
| 2007 | 0 | 1 | 0 | 0 | 8 | |||||||
| 2008 | 1 | 1 | 0 | 0 | 0 | 0 | 0 | 1 | ||||
| 2009 | 0 | 1 | 533 | 545 | 1 | 0 | 1 | 0 | 2 | |||
| 2010 | 0 | 0 | 0 | 1 | 1 | 1 | 1 | 1 | 1 | |||
| 2011 | 0 | 1 | 0 | 0 | 1 | 0 | 0 | 0 | ||||
| 2012 | 1 | 0 | 0 | 2 | 1 | 1 | 0 | 0 | ||||
| 2013 | 0 | 0 | 1 | 1 | 1 | 1 | 0 | 0 | ||||
| 2014 | 575 | 0 | 1 | 0 | 1 | 553 | 1 | 578 | 2 | 0 | ||
| 2015 | 2 | 2 | 2 | 0 | 3 | 1 | 4 | 1 | 4 | 2 | ||
| 2016 | 0 | 548 | 1 | 572 | 426 | 559 | 1 | 3 | 2 | 1 | ||
| 2017 | 2 | 552 | 0 | 2 | 1,157 | 3 | 998 | 560 | 0 | 1,450 | 586 | |
| 2018 | 0 | 589 | 554 | 577 | 572 | 1 | 3 | 586 | 2 | |||
| 2019 | 2 | 552 | 584 | 0 | 587 | 581 | 2 | 575 | 587 | 2 | 586 | |
| 2020 | 1 | 581 | 3 | 572 | 574 | 576 | 583 | 1 | 573 | 556 | 1 | |
| 2021 | 0 | 576 | 2 | 581 | 553 | 580 | 0 | 605 | 575 | 571 | 582 | |
| 2022 | 0 | 577 | 5 | 626 | 534 | 581 | 577 | 583 | 550 | |||
| 2023 | 554 | 551 | 588 | 61 | 585 | 633 | 1,377 | 583 | ||||
| 2024 | 0 | |||||||||||
| - = No Data Reported; -- = Not Applicable; NA = Not Available; W = Withheld to avoid disclosure of individual company data. |
| Release Date: 3/29/2024 |
| Next Release Date: 4/30/2024 |