|
Download Data (XLS File) |
|
||||||||
|
||||||||
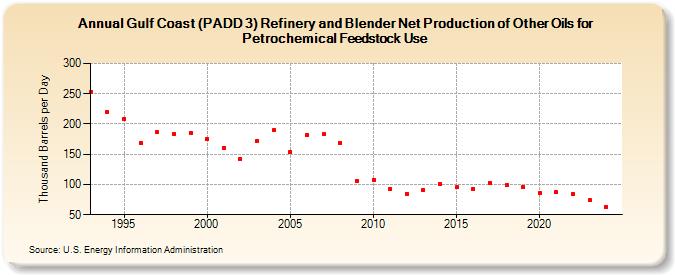
| Gulf Coast (PADD 3) Refinery and Blender Net Production of Other Oils for Petrochemical Feedstock Use (Thousand Barrels per Day) | ||||||||
| Decade | Year-0 | Year-1 | Year-2 | Year-3 | Year-4 | Year-5 | Year-6 | Year-7 | Year-8 | Year-9 |
|---|---|---|---|---|---|---|---|---|---|---|
| 1990's | 253 | 220 | 209 | 169 | 186 | 184 | 185 | |||
| 2000's | 175 | 161 | 142 | 172 | 190 | 154 | 182 | 183 | 169 | 106 |
| 2010's | 108 | 93 | 85 | 91 | 100 | 95 | 93 | 103 | 99 | 96 |
| 2020's | 86 | 87 | 84 | 73 |
| - = No Data Reported; -- = Not Applicable; NA = Not Available; W = Withheld to avoid disclosure of individual company data. |
| Release Date: 3/29/2024 |
| Next Release Date: 8/30/2024 |