|
Download Data (XLS File) |
|
||||||||
|
||||||||
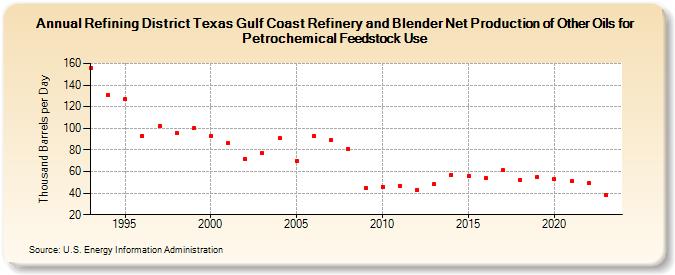
| Refining District Texas Gulf Coast Refinery and Blender Net Production of Other Oils for Petrochemical Feedstock Use (Thousand Barrels per Day) | ||||||||
| Decade | Year-0 | Year-1 | Year-2 | Year-3 | Year-4 | Year-5 | Year-6 | Year-7 | Year-8 | Year-9 |
|---|---|---|---|---|---|---|---|---|---|---|
| 1990's | 156 | 131 | 127 | 93 | 102 | 96 | 100 | |||
| 2000's | 93 | 86 | 72 | 77 | 91 | 70 | 93 | 89 | 81 | 45 |
| 2010's | 46 | 47 | 43 | 48 | 57 | 56 | 54 | 61 | 52 | 55 |
| 2020's | 53 | 51 | 49 | 38 | 33 |
| - = No Data Reported; -- = Not Applicable; NA = Not Available; W = Withheld to avoid disclosure of individual company data. |
| Release Date: 6/30/2025 |
| Next Release Date: 8/29/2025 |