|
Download Data (XLS File) |
|
||||||||
|
||||||||
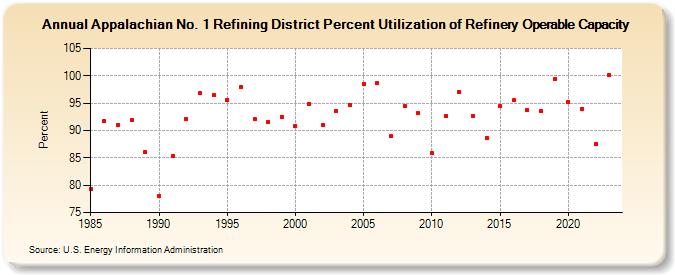
| Appalachian No. 1 Refining District Percent Utilization of Refinery Operable Capacity (Percent) | ||||||||
| Decade | Year-0 | Year-1 | Year-2 | Year-3 | Year-4 | Year-5 | Year-6 | Year-7 | Year-8 | Year-9 |
|---|---|---|---|---|---|---|---|---|---|---|
| 1980's | 79.3 | 91.7 | 91.0 | 92.0 | 86.0 | |||||
| 1990's | 78.1 | 85.3 | 92.1 | 96.8 | 96.5 | 95.6 | 97.9 | 92.1 | 91.6 | 92.5 |
| 2000's | 90.9 | 94.9 | 91.0 | 93.5 | 94.6 | 98.5 | 98.7 | 88.9 | 94.4 | 93.2 |
| 2010's | 85.8 | 92.6 | 97.1 | 92.7 | 88.7 | 94.5 | 95.5 | 93.8 | 93.6 | 99.4 |
| 2020's | 95.2 | 94.0 | 87.5 | 100.1 |
| - = No Data Reported; -- = Not Applicable; NA = Not Available; W = Withheld to avoid disclosure of individual company data. |
| Release Date: 3/29/2024 |
| Next Release Date: 8/30/2024 |