|
Download Data (XLS File) |
|
||||||||
|
||||||||
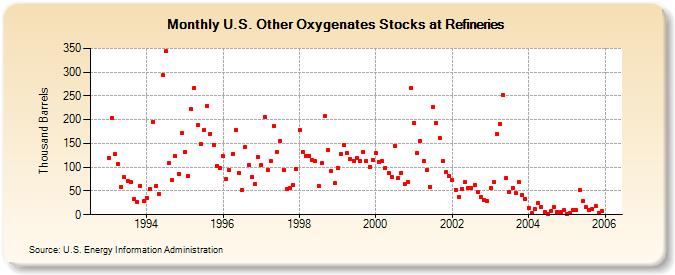
| U.S. Other Oxygenates Stocks at Refineries (Thousand Barrels) | ||||||||
| Year | Jan | Feb | Mar | Apr | May | Jun | Jul | Aug | Sep | Oct | Nov | Dec |
|---|---|---|---|---|---|---|---|---|---|---|---|---|
| 1993 | 120 | 203 | 127 | 107 | 59 | 79 | 71 | 68 | 33 | 27 | 60 | 28 |
| 1994 | 35 | 54 | 196 | 61 | 44 | 294 | 345 | 109 | 73 | 123 | 86 | 171 |
| 1995 | 133 | 82 | 222 | 267 | 188 | 149 | 178 | 229 | 170 | 147 | 103 | 98 |
| 1996 | 123 | 76 | 94 | 128 | 179 | 87 | 53 | 143 | 105 | 80 | 65 | 121 |
| 1997 | 105 | 206 | 94 | 112 | 187 | 133 | 155 | 94 | 54 | 56 | 62 | 96 |
| 1998 | 178 | 132 | 124 | 124 | 115 | 112 | 61 | 108 | 207 | 137 | 92 | 66 |
| 1999 | 99 | 128 | 147 | 129 | 117 | 114 | 119 | 114 | 132 | 113 | 100 | 115 |
| 2000 | 129 | 110 | 112 | 99 | 88 | 80 | 145 | 77 | 88 | 64 | 69 | 267 |
| 2001 | 194 | 130 | 155 | 112 | 94 | 59 | 227 | 194 | 162 | 112 | 89 | 81 |
| 2002 | 73 | 53 | 37 | 55 | 69 | 57 | 56 | 62 | 47 | 38 | 31 | 29 |
| 2003 | 56 | 69 | 170 | 191 | 251 | 78 | 48 | 57 | 45 | 68 | 42 | 34 |
| 2004 | 14 | 3 | 12 | 24 | 17 | 5 | 2 | 7 | 16 | 6 | 5 | 9 |
| 2005 | 2 | 4 | 10 | 9 | 51 | 29 | 16 | 10 | 12 | 18 | 3 | 7 |
| - = No Data Reported; -- = Not Applicable; NA = Not Available; W = Withheld to avoid disclosure of individual company data. |
| Release Date: 3/29/2024 |
| Next Release Date: 4/30/2024 |