|
Download Data (XLS File) |
|
||||||||
|
||||||||
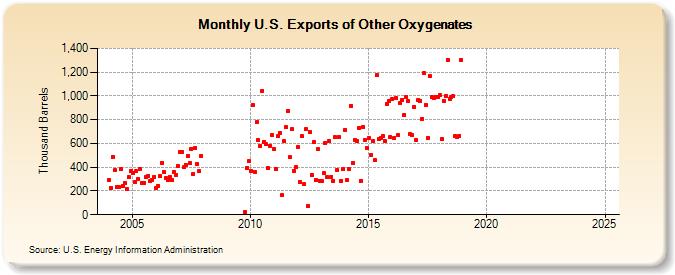
| U.S. Exports of Other Oxygenates (Thousand Barrels) | ||||||||
| Year | Jan | Feb | Mar | Apr | May | Jun | Jul | Aug | Sep | Oct | Nov | Dec |
|---|---|---|---|---|---|---|---|---|---|---|---|---|
| 2004 | 295 | 226 | 488 | 373 | 235 | 230 | 382 | 243 | 268 | 217 | 317 | 366 |
| 2005 | 353 | 277 | 365 | 301 | 382 | 267 | 270 | 317 | 325 | 284 | 289 | 317 |
| 2006 | 228 | 244 | 323 | 439 | 358 | 305 | 288 | 320 | 290 | 358 | 338 | 408 |
| 2007 | 524 | 530 | 399 | 421 | 493 | 436 | 556 | 346 | 560 | 426 | 365 | 494 |
| 2009 | 22 | 393 | 449 | |||||||||
| 2010 | 369 | 922 | 363 | 779 | 630 | 578 | 1,045 | 614 | 593 | 393 | 582 | 668 |
| 2011 | 553 | 382 | 661 | 691 | 164 | 618 | 736 | 874 | 482 | 719 | 368 | 401 |
| 2012 | 570 | 279 | 662 | 256 | 718 | 72 | 697 | 335 | 612 | 288 | 551 | 287 |
| 2013 | 287 | 351 | 603 | 319 | 618 | 321 | 287 | 651 | 377 | 653 | 287 | 384 |
| 2014 | 715 | 288 | 381 | 918 | 436 | 633 | 618 | 730 | 287 | 739 | 632 | 558 |
| 2015 | 647 | 506 | 617 | 458 | 1,172 | 637 | 647 | 659 | 621 | 930 | 955 | 654 |
| 2016 | 976 | 648 | 981 | 668 | 938 | 964 | 841 | 992 | 956 | 677 | 672 | 910 |
| 2017 | 626 | 968 | 958 | 807 | 1,191 | 926 | 644 | 1,170 | 987 | 985 | 990 | 990 |
| 2018 | 1,005 | 636 | 957 | 999 | 1,303 | 978 | 993 | 997 | 660 | 656 | 663 | 1,306 |
| 2019 | -- | -- | -- | -- | -- | -- | -- | -- | -- | -- | -- | -- |
| 2020 | -- | -- | -- | -- | -- | -- | -- | -- | -- | -- | -- | -- |
| 2021 | -- | -- | -- | -- | -- | -- | -- | -- | -- | -- | -- | |
| 2022 | -- | -- | -- | -- | -- | -- | -- | -- | -- | -- | -- | -- |
| 2023 | -- | -- | -- | -- | -- | -- | -- | -- | -- | -- | -- | -- |
| 2024 | -- | -- | -- | -- | ||||||||
| - = No Data Reported; -- = Not Applicable; NA = Not Available; W = Withheld to avoid disclosure of individual company data. |
| Release Date: 6/28/2024 |
| Next Release Date: 7/31/2024 |