|
Download Data (XLS File) |
|
||||||||
|
||||||||
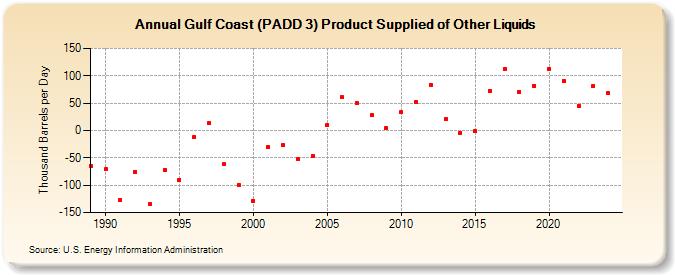
| Gulf Coast (PADD 3) Product Supplied of Other Liquids (Thousand Barrels per Day) | ||||||||
| Decade | Year-0 | Year-1 | Year-2 | Year-3 | Year-4 | Year-5 | Year-6 | Year-7 | Year-8 | Year-9 |
|---|---|---|---|---|---|---|---|---|---|---|
| 1980's | -65 | |||||||||
| 1990's | -71 | -127 | -75 | -135 | -72 | -90 | -12 | 13 | -62 | -99 |
| 2000's | -128 | -30 | -27 | -53 | -47 | 10 | 61 | 50 | 28 | 4 |
| 2010's | 33 | 52 | 84 | 21 | -4 | -1 | 73 | 112 | 71 | 82 |
| 2020's | 113 | 91 | 45 | 83 |
| - = No Data Reported; -- = Not Applicable; NA = Not Available; W = Withheld to avoid disclosure of individual company data. |
| Release Date: 3/29/2024 |
| Next Release Date: 8/30/2024 |