|
Download Data (XLS File) |
|
||||||||
|
||||||||
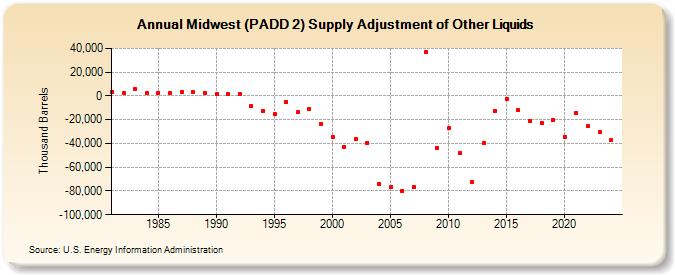
| Midwest (PADD 2) Supply Adjustment of Other Liquids (Thousand Barrels) | ||||||||
| Decade | Year-0 | Year-1 | Year-2 | Year-3 | Year-4 | Year-5 | Year-6 | Year-7 | Year-8 | Year-9 |
|---|---|---|---|---|---|---|---|---|---|---|
| 1980's | 3,396 | 2,604 | 5,747 | 2,403 | 2,725 | 2,421 | 3,320 | 3,421 | 2,377 | |
| 1990's | 1,517 | 1,564 | 1,829 | -8,824 | -12,686 | -15,102 | -4,828 | -13,819 | -10,897 | -23,836 |
| 2000's | -34,480 | -42,999 | -36,412 | -39,366 | -74,009 | -77,051 | -80,456 | -76,922 | 37,282 | -44,228 |
| 2010's | -27,352 | -48,127 | -72,621 | -39,815 | -12,420 | -2,722 | -12,258 | -21,318 | -22,693 | -20,009 |
| 2020's | -34,338 | -14,249 | -24,935 | -31,764 |
| - = No Data Reported; -- = Not Applicable; NA = Not Available; W = Withheld to avoid disclosure of individual company data. |
| Release Date: 3/29/2024 |
| Next Release Date: 8/30/2024 |