|
Download Data (XLS File) |
|
||||||||
|
||||||||
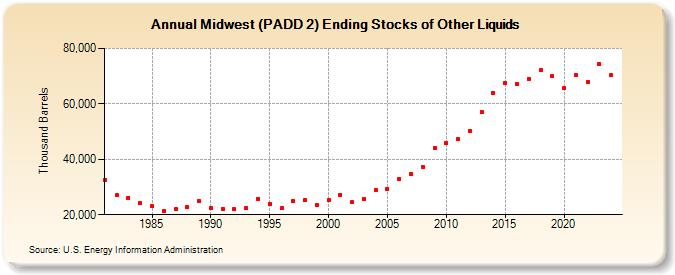
| Midwest (PADD 2) Ending Stocks of Other Liquids (Thousand Barrels) | ||||||||
| Decade | Year-0 | Year-1 | Year-2 | Year-3 | Year-4 | Year-5 | Year-6 | Year-7 | Year-8 | Year-9 |
|---|---|---|---|---|---|---|---|---|---|---|
| 1980's | 32,525 | 27,073 | 26,149 | 24,207 | 23,196 | 21,352 | 21,909 | 22,673 | 24,881 | |
| 1990's | 22,434 | 22,133 | 21,924 | 22,411 | 25,716 | 24,005 | 22,245 | 24,786 | 25,153 | 23,501 |
| 2000's | 25,235 | 27,253 | 24,525 | 25,580 | 28,886 | 29,436 | 32,876 | 34,608 | 37,346 | 43,990 |
| 2010's | 45,863 | 47,382 | 50,299 | 57,216 | 64,040 | 67,347 | 67,133 | 69,079 | 72,077 | 69,930 |
| 2020's | 65,609 | 70,239 | 68,013 | 74,182 |
| - = No Data Reported; -- = Not Applicable; NA = Not Available; W = Withheld to avoid disclosure of individual company data. |
| Release Date: 3/29/2024 |
| Next Release Date: 8/30/2024 |