|
Download Data (XLS File) |
|
||||||||
|
||||||||
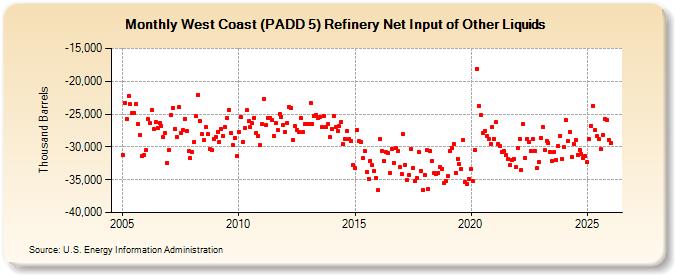
| West Coast (PADD 5) Refinery Net Input of Other Liquids (Thousand Barrels) | ||||||||
| Year | Jan | Feb | Mar | Apr | May | Jun | Jul | Aug | Sep | Oct | Nov | Dec |
|---|---|---|---|---|---|---|---|---|---|---|---|---|
| 2005 | -31,232 | -23,267 | -25,791 | -22,273 | -23,530 | -24,764 | -24,845 | -23,540 | -26,566 | -28,122 | -31,449 | -31,309 |
| 2006 | -30,511 | -25,735 | -26,433 | -24,424 | -27,308 | -26,195 | -27,153 | -26,414 | -26,805 | -28,533 | -27,890 | -32,430 |
| 2007 | -30,405 | -25,154 | -24,006 | -27,259 | -28,431 | -23,947 | -27,818 | -27,500 | -25,708 | -27,611 | -30,619 | -31,667 |
| 2008 | -30,797 | -29,240 | -25,311 | -22,045 | -26,097 | -28,066 | -29,013 | -26,979 | -28,094 | -30,390 | -30,463 | -28,735 |
| 2009 | -28,514 | -27,657 | -29,220 | -27,315 | -28,301 | -26,996 | -25,548 | -24,355 | -27,942 | -29,715 | -28,577 | -31,436 |
| 2010 | -27,671 | -25,426 | -29,192 | -27,117 | -24,456 | -26,114 | -27,022 | -26,427 | -25,555 | -27,832 | -28,328 | -29,785 |
| 2011 | -26,556 | -22,647 | -26,684 | -25,555 | -25,569 | -25,892 | -28,320 | -26,415 | -27,431 | -25,029 | -25,382 | -26,675 |
| 2012 | -27,673 | -26,324 | -23,877 | -24,119 | -28,897 | -26,824 | -27,372 | -27,685 | -25,571 | -27,773 | -26,553 | -26,562 |
| 2013 | -26,452 | -23,288 | -26,454 | -25,248 | -25,073 | -25,618 | -25,389 | -27,019 | -25,250 | -27,006 | -26,461 | -28,556 |
| 2014 | -27,270 | -25,313 | -27,032 | -27,507 | -26,893 | -26,210 | -29,580 | -28,871 | -27,572 | -28,808 | -29,118 | -32,747 |
| 2015 | -33,278 | -27,435 | -29,176 | -29,218 | -31,742 | -30,694 | -33,850 | -34,867 | -32,073 | -32,804 | -33,637 | -34,750 |
| 2016 | -36,636 | -28,831 | -30,587 | -32,136 | -30,815 | -30,897 | -33,953 | -30,289 | -32,409 | -30,110 | -30,691 | -33,036 |
| 2017 | -34,139 | -28,110 | -32,682 | -34,971 | -34,247 | -30,307 | -33,177 | -35,231 | -34,768 | -30,735 | -33,636 | -36,600 |
| 2018 | -34,271 | -30,506 | -36,362 | -30,642 | -32,173 | -33,959 | -34,088 | -33,918 | -33,124 | -33,305 | -35,425 | -35,259 |
| 2019 | -34,402 | -30,650 | -30,100 | -29,579 | -33,993 | -31,786 | -32,649 | -33,335 | -28,897 | -35,324 | -35,675 | -34,873 |
| 2020 | -33,431 | -35,219 | -30,436 | -18,099 | -23,735 | -25,208 | -27,901 | -27,577 | -28,307 | -28,755 | -29,562 | -26,898 |
| 2021 | -28,858 | -26,282 | -29,496 | -29,896 | -30,723 | -30,664 | -31,258 | -31,909 | -32,764 | -31,998 | -31,843 | -33,085 |
| 2022 | -30,222 | -28,737 | -33,545 | -26,465 | -31,616 | -28,754 | -29,186 | -30,577 | -28,860 | -30,619 | -33,280 | -32,329 |
| 2023 | -28,604 | -27,012 | -30,445 | -29,051 | -29,425 | -30,768 | -32,146 | -30,828 | -31,900 | -29,889 | -28,343 | -31,818 |
| 2024 | -30,097 | |||||||||||
| - = No Data Reported; -- = Not Applicable; NA = Not Available; W = Withheld to avoid disclosure of individual company data. |
| Release Date: 3/29/2024 |
| Next Release Date: 4/30/2024 |
Referring Pages: