|
Download Data (XLS File) |
|
||||||||
|
||||||||
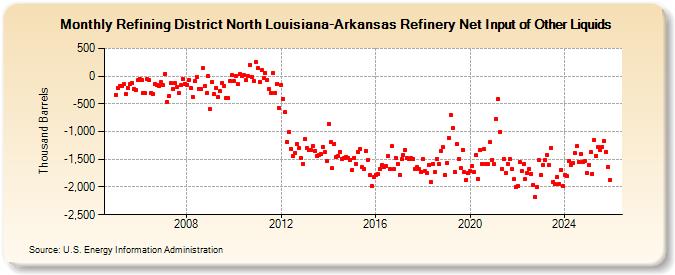
| Refining District North Louisiana-Arkansas Refinery Net Input of Other Liquids (Thousand Barrels) | ||||||||
| Year | Jan | Feb | Mar | Apr | May | Jun | Jul | Aug | Sep | Oct | Nov | Dec |
|---|---|---|---|---|---|---|---|---|---|---|---|---|
| 2005 | -332 | -211 | -178 | -175 | -143 | -326 | -206 | -145 | -117 | -224 | -253 | -77 |
| 2006 | -49 | -68 | -296 | -310 | -57 | -75 | -299 | -319 | -145 | -156 | -171 | -107 |
| 2007 | -166 | 47 | -468 | -360 | -127 | -227 | -133 | -193 | -309 | -169 | -50 | -140 |
| 2008 | -153 | -67 | -222 | -371 | -87 | -14 | -224 | -228 | 138 | -185 | -309 | -6 |
| 2009 | -600 | -106 | -329 | -207 | -385 | -274 | -121 | -176 | -391 | -400 | -88 | 12 |
| 2010 | -86 | 4 | -148 | 38 | 1 | 15 | -77 | 6 | 207 | -12 | -89 | 263 |
| 2011 | 143 | -102 | 102 | -40 | 59 | -68 | -229 | -301 | 54 | -296 | -135 | -577 |
| 2012 | -156 | -413 | -646 | -1,190 | -1,010 | -1,307 | -1,437 | -1,378 | -1,227 | -1,288 | -1,481 | -1,581 |
| 2013 | -1,142 | -1,303 | -1,340 | -1,340 | -1,263 | -1,345 | -1,437 | -1,421 | -1,405 | -1,271 | -1,373 | -1,538 |
| 2014 | -860 | -1,192 | -1,664 | -1,220 | -1,459 | -1,449 | -1,363 | -1,495 | -1,473 | -1,455 | -1,470 | -1,506 |
| 2015 | -1,689 | -1,470 | -1,581 | -1,367 | -1,315 | -1,645 | -1,677 | -1,355 | -1,508 | -1,789 | -1,979 | -1,816 |
| 2016 | -1,775 | -1,767 | -1,668 | -1,609 | -1,647 | -1,615 | -1,446 | -1,674 | -1,269 | -1,678 | -1,472 | -1,581 |
| 2017 | -1,781 | -1,500 | -1,418 | -1,327 | -1,479 | -1,498 | -1,486 | -1,495 | -1,675 | -1,636 | -1,678 | -1,723 |
| 2018 | -1,498 | -1,713 | -1,749 | -1,601 | -1,906 | -1,578 | -1,738 | -1,491 | -1,588 | -1,349 | -1,279 | -1,785 |
| 2019 | -1,559 | -1,108 | -693 | -937 | -1,723 | -1,224 | -1,498 | -1,662 | -1,326 | -1,734 | -1,869 | -1,754 |
| 2020 | -1,714 | -1,618 | -1,732 | -1,423 | -1,852 | -1,329 | -1,579 | -1,315 | -1,593 | -1,594 | -1,197 | -1,507 |
| 2021 | -1,590 | -780 | -416 | -1,000 | -1,671 | -1,491 | -1,744 | -1,580 | -1,500 | -1,680 | -1,862 | -2,008 |
| 2022 | -1,981 | -1,550 | -1,712 | -1,584 | -1,856 | -1,743 | -1,668 | -1,765 | -1,962 | -2,184 | -2,000 | -1,519 |
| 2023 | -1,783 | -1,601 | -1,507 | -1,414 | -1,602 | -1,293 | -1,902 | -1,953 | -1,818 | -1,944 | -1,685 | -1,988 |
| 2024 | -1,757 | -1,811 | -1,526 | -1,595 | ||||||||
| - = No Data Reported; -- = Not Applicable; NA = Not Available; W = Withheld to avoid disclosure of individual company data. |
| Release Date: 6/28/2024 |
| Next Release Date: 7/31/2024 |