|
Download Data (XLS File) |
|
||||||||
|
||||||||
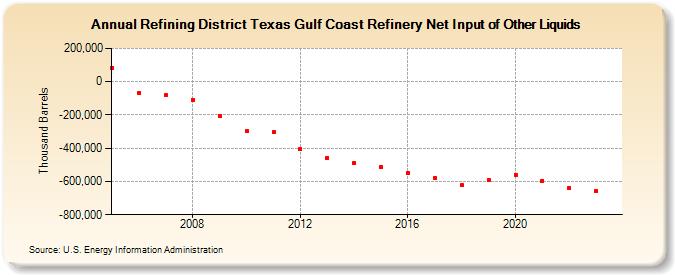
| Refining District Texas Gulf Coast Refinery Net Input of Other Liquids (Thousand Barrels) | ||||||||
| Decade | Year-0 | Year-1 | Year-2 | Year-3 | Year-4 | Year-5 | Year-6 | Year-7 | Year-8 | Year-9 |
|---|---|---|---|---|---|---|---|---|---|---|
| 2000's | 82,365 | -67,775 | -81,799 | -108,507 | -207,739 | |||||
| 2010's | -296,609 | -304,150 | -403,428 | -456,364 | -488,043 | -512,452 | -546,483 | -577,169 | -621,943 | -592,125 |
| 2020's | -558,930 | -594,512 | -642,203 | -658,505 |
| - = No Data Reported; -- = Not Applicable; NA = Not Available; W = Withheld to avoid disclosure of individual company data. |
| Release Date: 3/29/2024 |
| Next Release Date: 8/30/2024 |
Referring Pages: