|
Download Data (XLS File) |
|
||||||||
|
||||||||
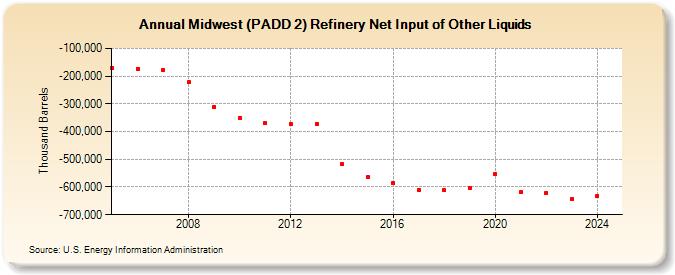
| Midwest (PADD 2) Refinery Net Input of Other Liquids (Thousand Barrels) | ||||||||
| Decade | Year-0 | Year-1 | Year-2 | Year-3 | Year-4 | Year-5 | Year-6 | Year-7 | Year-8 | Year-9 |
|---|---|---|---|---|---|---|---|---|---|---|
| 2000's | -170,924 | -172,608 | -179,160 | -222,981 | -311,146 | |||||
| 2010's | -350,278 | -369,298 | -372,049 | -372,549 | -518,717 | -564,058 | -585,596 | -609,087 | -611,890 | -602,597 |
| 2020's | -553,247 | -618,553 | -621,413 | -643,622 |
| - = No Data Reported; -- = Not Applicable; NA = Not Available; W = Withheld to avoid disclosure of individual company data. |
| Release Date: 6/28/2024 |
| Next Release Date: 8/30/2024 |
Referring Pages: