|
Download Data (XLS File) |
|
||||||||
|
||||||||
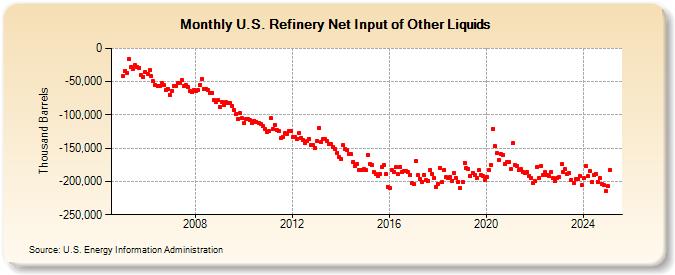
| U.S. Refinery Net Input of Other Liquids (Thousand Barrels) | ||||||||
| Year | Jan | Feb | Mar | Apr | May | Jun | Jul | Aug | Sep | Oct | Nov | Dec |
|---|---|---|---|---|---|---|---|---|---|---|---|---|
| 2005 | -42,195 | -33,438 | -37,103 | -16,264 | -27,849 | -30,666 | -25,056 | -27,232 | -29,194 | -40,575 | -42,385 | -35,732 |
| 2006 | -38,061 | -32,866 | -42,126 | -49,686 | -55,187 | -57,043 | -57,210 | -52,057 | -55,113 | -62,641 | -60,953 | -69,638 |
| 2007 | -64,224 | -56,409 | -57,243 | -52,395 | -51,427 | -47,720 | -56,986 | -54,316 | -58,281 | -64,160 | -66,056 | -62,243 |
| 2008 | -64,049 | -62,543 | -54,342 | -45,503 | -60,325 | -60,344 | -62,481 | -66,761 | -66,303 | -77,590 | -81,316 | -78,144 |
| 2009 | -87,759 | -80,770 | -85,676 | -81,035 | -81,473 | -82,108 | -85,925 | -92,865 | -98,331 | -105,632 | -97,712 | -105,189 |
| 2010 | -111,866 | -105,510 | -105,902 | -108,143 | -111,637 | -108,513 | -110,069 | -112,048 | -113,123 | -117,012 | -120,603 | -126,021 |
| 2011 | -124,580 | -105,186 | -120,785 | -114,451 | -121,916 | -123,871 | -135,288 | -132,484 | -127,742 | -128,723 | -124,243 | -124,551 |
| 2012 | -133,164 | -132,774 | -135,460 | -127,359 | -134,208 | -137,697 | -142,481 | -139,844 | -135,451 | -144,966 | -145,035 | -149,309 |
| 2013 | -139,636 | -119,037 | -141,344 | -136,857 | -135,822 | -139,923 | -144,245 | -144,350 | -148,290 | -150,947 | -156,946 | -163,152 |
| 2014 | -166,207 | -145,440 | -151,515 | -152,823 | -158,159 | -159,240 | -170,424 | -176,316 | -173,813 | -183,311 | -183,060 | -182,030 |
| 2015 | -183,358 | -160,429 | -173,886 | -175,762 | -185,911 | -189,006 | -191,533 | -188,256 | -178,180 | -176,002 | -189,525 | -207,631 |
| 2016 | -209,773 | -183,335 | -185,520 | -178,705 | -188,890 | -177,939 | -185,583 | -183,741 | -183,969 | -185,781 | -190,112 | -202,927 |
| 2017 | -204,313 | -169,584 | -190,462 | -195,667 | -200,484 | -189,998 | -198,097 | -198,815 | -182,319 | -188,558 | -195,317 | -208,648 |
| 2018 | -203,338 | -179,121 | -200,875 | -182,171 | -193,947 | -194,983 | -193,151 | -198,815 | -187,474 | -195,068 | -200,488 | -209,848 |
| 2019 | -200,696 | -171,575 | -179,626 | -180,995 | -192,332 | -187,355 | -189,581 | -195,025 | -183,285 | -189,703 | -191,237 | -197,448 |
| 2020 | -192,878 | -183,448 | -175,011 | -120,599 | -147,138 | -157,831 | -167,685 | -158,711 | -160,107 | -173,456 | -171,355 | -170,243 |
| 2021 | -181,740 | -142,845 | -175,189 | -176,424 | -183,183 | -181,735 | -185,322 | -187,325 | -186,049 | -191,582 | -194,963 | -202,501 |
| 2022 | -199,891 | -177,795 | -194,383 | -176,206 | -191,012 | -186,416 | -189,721 | -192,279 | -185,271 | -195,291 | -198,748 | -194,864 |
| 2023 | -192,914 | -174,527 | -185,778 | -181,489 | -188,433 | -186,884 | -197,714 | -201,497 | -196,060 | -195,760 | -191,487 | -205,543 |
| 2024 | -195,328 | |||||||||||
| - = No Data Reported; -- = Not Applicable; NA = Not Available; W = Withheld to avoid disclosure of individual company data. |
| Release Date: 3/29/2024 |
| Next Release Date: 4/30/2024 |
Referring Pages: