|
Download Data (XLS File) |
|
||||||||
|
||||||||
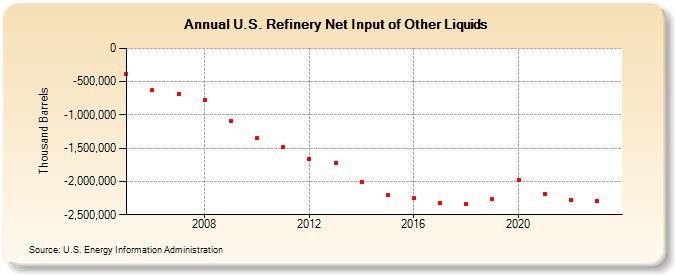
| U.S. Refinery Net Input of Other Liquids (Thousand Barrels) | ||||||||
| Decade | Year-0 | Year-1 | Year-2 | Year-3 | Year-4 | Year-5 | Year-6 | Year-7 | Year-8 | Year-9 |
|---|---|---|---|---|---|---|---|---|---|---|
| 2000's | -387,689 | -632,581 | -691,460 | -779,701 | -1,084,475 | |||||
| 2010's | -1,350,447 | -1,483,820 | -1,657,748 | -1,720,549 | -2,002,338 | -2,199,479 | -2,256,275 | -2,322,262 | -2,339,279 | -2,258,858 |
| 2020's | -1,978,462 | -2,188,858 | -2,281,877 | -2,298,086 |
| - = No Data Reported; -- = Not Applicable; NA = Not Available; W = Withheld to avoid disclosure of individual company data. |
| Release Date: 3/29/2024 |
| Next Release Date: 8/30/2024 |
Referring Pages: