|
Download Data (XLS File) |
|
||||||||
|
||||||||
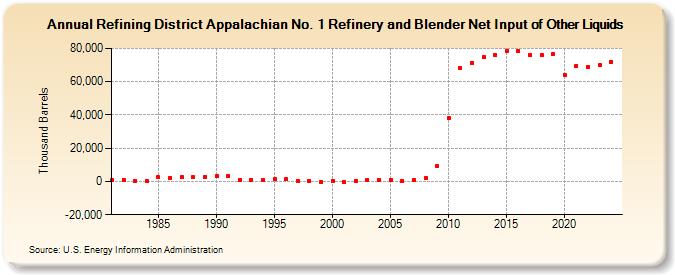
| Refining District Appalachian No. 1 Refinery and Blender Net Input of Other Liquids (Thousand Barrels) | ||||||||
| Decade | Year-0 | Year-1 | Year-2 | Year-3 | Year-4 | Year-5 | Year-6 | Year-7 | Year-8 | Year-9 |
|---|---|---|---|---|---|---|---|---|---|---|
| 1980's | 822 | 1,069 | 541 | 224 | 2,442 | 2,283 | 2,403 | 2,392 | 2,932 | |
| 1990's | 3,321 | 3,136 | 1,040 | 967 | 810 | 1,222 | 1,221 | 451 | 42 | -476 |
| 2000's | 351 | -280 | 294 | 1,137 | 946 | 1,015 | 508 | 842 | 2,218 | 9,003 |
| 2010's | 38,109 | 68,446 | 71,311 | 74,907 | 76,125 | 78,535 | 78,440 | 76,040 | 75,948 | 76,555 |
| 2020's | 63,877 | 69,481 | 69,071 | 69,283 |
| - = No Data Reported; -- = Not Applicable; NA = Not Available; W = Withheld to avoid disclosure of individual company data. |
| Release Date: 6/28/2024 |
| Next Release Date: 8/30/2024 |