|
Download Data (XLS File) |
|
||||||||
|
||||||||
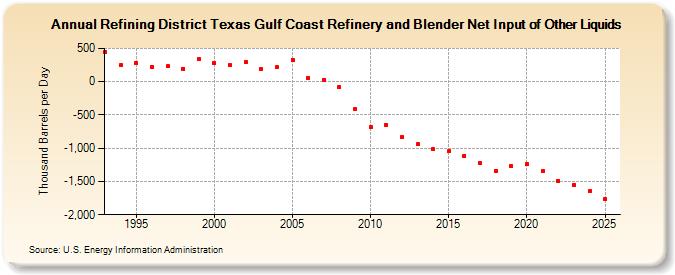
| Refining District Texas Gulf Coast Refinery and Blender Net Input of Other Liquids (Thousand Barrels per Day) | ||||||||
| Decade | Year-0 | Year-1 | Year-2 | Year-3 | Year-4 | Year-5 | Year-6 | Year-7 | Year-8 | Year-9 |
|---|---|---|---|---|---|---|---|---|---|---|
| 1990's | 446 | 250 | 287 | 223 | 230 | 196 | 334 | |||
| 2000's | 280 | 248 | 293 | 184 | 214 | 331 | 58 | 31 | -78 | -418 |
| 2010's | -684 | -649 | -832 | -941 | -1,017 | -1,047 | -1,110 | -1,228 | -1,337 | -1,269 |
| 2020's | -1,242 | -1,349 | -1,489 | -1,549 |
| - = No Data Reported; -- = Not Applicable; NA = Not Available; W = Withheld to avoid disclosure of individual company data. |
| Release Date: 8/30/2024 |
| Next Release Date: 8/29/2025 |