|
Download Data (XLS File) |
|
||||||||
|
||||||||
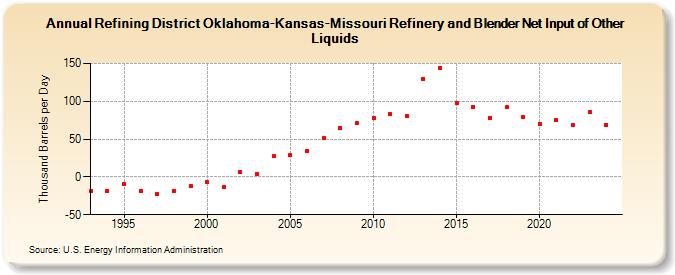
| Refining District Oklahoma-Kansas-Missouri Refinery and Blender Net Input of Other Liquids (Thousand Barrels per Day) | ||||||||
| Decade | Year-0 | Year-1 | Year-2 | Year-3 | Year-4 | Year-5 | Year-6 | Year-7 | Year-8 | Year-9 |
|---|---|---|---|---|---|---|---|---|---|---|
| 1990's | -19 | -19 | -10 | -18 | -23 | -18 | -12 | |||
| 2000's | -7 | -14 | 6 | 4 | 27 | 29 | 34 | 51 | 65 | 71 |
| 2010's | 78 | 83 | 80 | 130 | 144 | 98 | 93 | 78 | 92 | 79 |
| 2020's | 70 | 75 | 68 | 86 |
| - = No Data Reported; -- = Not Applicable; NA = Not Available; W = Withheld to avoid disclosure of individual company data. |
| Release Date: 3/29/2024 |
| Next Release Date: 8/30/2024 |