|
Download Data (XLS File) |
|
||||||||
|
||||||||
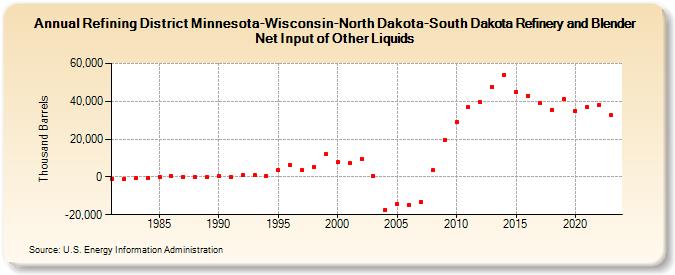
| Refining District Minnesota-Wisconsin-North Dakota-South Dakota Refinery and Blender Net Input of Other Liquids (Thousand Barrels) | ||||||||
| Decade | Year-0 | Year-1 | Year-2 | Year-3 | Year-4 | Year-5 | Year-6 | Year-7 | Year-8 | Year-9 |
|---|---|---|---|---|---|---|---|---|---|---|
| 1980's | -865 | -1,078 | -707 | -325 | 203 | 333 | 174 | -42 | -116 | |
| 1990's | 331 | 141 | 806 | 763 | 523 | 3,773 | 6,372 | 3,660 | 5,354 | 12,112 |
| 2000's | 7,938 | 7,334 | 9,611 | 344 | -17,292 | -14,471 | -14,663 | -13,102 | 3,395 | 19,522 |
| 2010's | 28,953 | 36,805 | 39,481 | 47,818 | 53,982 | 44,853 | 42,981 | 38,938 | 35,529 | 41,162 |
| 2020's | 34,987 | 36,834 | 38,114 | 32,604 |
| - = No Data Reported; -- = Not Applicable; NA = Not Available; W = Withheld to avoid disclosure of individual company data. |
| Release Date: 8/30/2024 |
| Next Release Date: 8/29/2025 |