|
Download Data (XLS File) |
|
||||||||
|
||||||||
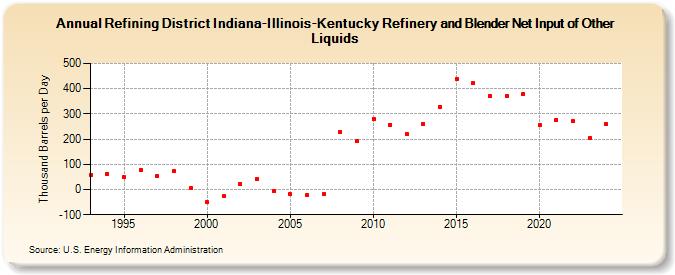
| Refining District Indiana-Illinois-Kentucky Refinery and Blender Net Input of Other Liquids (Thousand Barrels per Day) | ||||||||
| Decade | Year-0 | Year-1 | Year-2 | Year-3 | Year-4 | Year-5 | Year-6 | Year-7 | Year-8 | Year-9 |
|---|---|---|---|---|---|---|---|---|---|---|
| 1990's | 58 | 61 | 49 | 77 | 52 | 73 | 5 | |||
| 2000's | -51 | -27 | 21 | 43 | -4 | -19 | -21 | -18 | 229 | 191 |
| 2010's | 281 | 257 | 220 | 260 | 329 | 440 | 422 | 371 | 371 | 378 |
| 2020's | 254 | 276 | 270 | 205 |
| - = No Data Reported; -- = Not Applicable; NA = Not Available; W = Withheld to avoid disclosure of individual company data. |
| Release Date: 8/30/2024 |
| Next Release Date: 8/29/2025 |