|
Download Data (XLS File) |
|
||||||||
|
||||||||
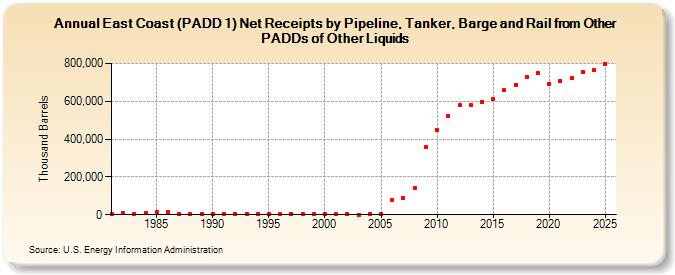
| East Coast (PADD 1) Net Receipts by Pipeline, Tanker, Barge and Rail from Other PADDs of Other Liquids (Thousand Barrels) | ||||||||
| Decade | Year-0 | Year-1 | Year-2 | Year-3 | Year-4 | Year-5 | Year-6 | Year-7 | Year-8 | Year-9 |
|---|---|---|---|---|---|---|---|---|---|---|
| 1980's | 2,389 | 9,169 | 5,913 | 8,590 | 13,044 | 13,725 | 4,692 | 3,668 | 5,200 | |
| 1990's | 4,805 | 6,229 | 4,826 | 5,175 | 4,478 | 3,128 | 6,232 | 5,385 | 6,170 | 3,286 |
| 2000's | 1,421 | 2,112 | 1,505 | 769 | 6,258 | 6,266 | 79,129 | 87,429 | 140,692 | 357,933 |
| 2010's | 448,615 | 522,670 | 581,755 | 580,840 | 597,982 | 612,848 | 657,802 | 688,119 | 730,558 | 747,863 |
| 2020's | 689,724 | 708,016 | 723,417 | 757,220 |
| - = No Data Reported; -- = Not Applicable; NA = Not Available; W = Withheld to avoid disclosure of individual company data. |
| Release Date: 3/29/2024 |
| Next Release Date: 8/30/2024 |