|
Download Data (XLS File) |
|
||||||||
|
||||||||
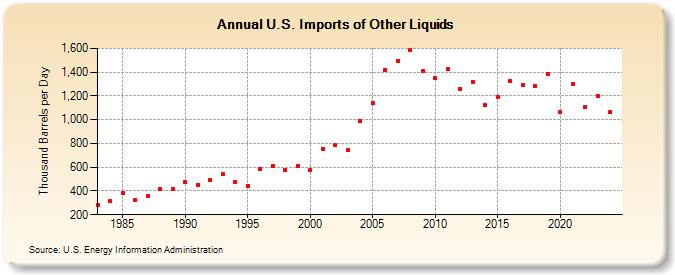
| U.S. Imports of Other Liquids (Thousand Barrels per Day) | ||||||||
| Decade | Year-0 | Year-1 | Year-2 | Year-3 | Year-4 | Year-5 | Year-6 | Year-7 | Year-8 | Year-9 |
|---|---|---|---|---|---|---|---|---|---|---|
| 1980's | 281 | 314 | 384 | 322 | 360 | 417 | 414 | |||
| 1990's | 476 | 452 | 493 | 539 | 473 | 443 | 585 | 614 | 579 | 609 |
| 2000's | 577 | 756 | 783 | 746 | 988 | 1,138 | 1,419 | 1,498 | 1,587 | 1,411 |
| 2010's | 1,352 | 1,423 | 1,257 | 1,316 | 1,121 | 1,194 | 1,329 | 1,293 | 1,287 | 1,388 |
| 2020's | 1,061 | 1,299 | 1,109 | 1,201 |
| - = No Data Reported; -- = Not Applicable; NA = Not Available; W = Withheld to avoid disclosure of individual company data. |
| Release Date: 3/29/2024 |
| Next Release Date: 8/30/2024 |