|
Download Data (XLS File) |
|
||||||||
|
||||||||
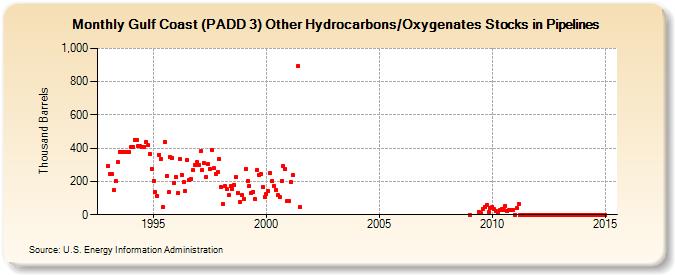
| Gulf Coast (PADD 3) Other Hydrocarbons/Oxygenates Stocks in Pipelines (Thousand Barrels) | ||||||||
| Year | Jan | Feb | Mar | Apr | May | Jun | Jul | Aug | Sep | Oct | Nov | Dec |
|---|---|---|---|---|---|---|---|---|---|---|---|---|
| 1993 | 292 | 242 | 242 | 148 | 201 | 314 | 380 | 380 | 380 | 379 | 378 | 377 |
| 1994 | 406 | 406 | 451 | 450 | 413 | 411 | 410 | 410 | 440 | 417 | 367 | 277 |
| 1995 | 205 | 138 | 114 | 362 | 336 | 44 | 437 | 233 | 135 | 345 | 342 | 193 |
| 1996 | 226 | 133 | 332 | 241 | 194 | 144 | 328 | 209 | 216 | 267 | 300 | 315 |
| 1997 | 301 | 381 | 266 | 308 | 228 | 303 | 277 | 388 | 278 | 246 | 256 | 335 |
| 1998 | 165 | 63 | 171 | 154 | 118 | 171 | 157 | 181 | 228 | 132 | 79 | 118 |
| 1999 | 96 | 277 | 202 | 174 | 128 | 138 | 92 | 268 | 239 | 243 | 167 | 105 |
| 2000 | 125 | 142 | 252 | 202 | 175 | 148 | 117 | 107 | 203 | 294 | 272 | 80 |
| 2001 | 81 | 195 | 237 | 894 | 46 | |||||||
| 2009 | 1 | 16 | 8 | 36 | 48 | 59 | 16 | 42 | ||||
| 2010 | 47 | 32 | 23 | 15 | 27 | 35 | 26 | 53 | 22 | 26 | 30 | 27 |
| 2011 | 1 | 39 | 67 | 1 | 1 | 1 | 1 | 1 | 1 | 1 | 1 | 1 |
| 2012 | 1 | 1 | 1 | 1 | 1 | 1 | 1 | 1 | 1 | 1 | 1 | 1 |
| 2013 | 1 | 1 | 1 | 1 | 1 | 1 | 1 | 1 | 1 | 1 | 1 | 1 |
| 2014 | 1 | 1 | 1 | 1 | 1 | 1 | 1 | 1 | 1 | 1 | 1 | 1 |
| 2015 | 1 | |||||||||||
| - = No Data Reported; -- = Not Applicable; NA = Not Available; W = Withheld to avoid disclosure of individual company data. |
| Release Date: 8/30/2024 |
| Next Release Date: 9/30/2024 |