|
Download Data (XLS File) |
|
||||||||
|
||||||||
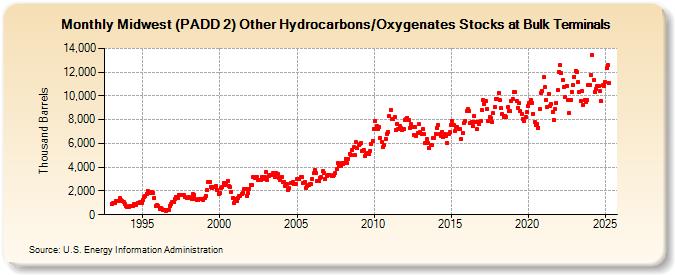
| Midwest (PADD 2) Other Hydrocarbons/Oxygenates Stocks at Bulk Terminals (Thousand Barrels) | ||||||||
| Year | Jan | Feb | Mar | Apr | May | Jun | Jul | Aug | Sep | Oct | Nov | Dec |
|---|---|---|---|---|---|---|---|---|---|---|---|---|
| 1993 | 887 | 946 | 966 | 1,135 | 1,157 | 1,179 | 1,376 | 1,217 | 1,149 | 1,040 | 862 | 701 |
| 1994 | 620 | 666 | 743 | 693 | 720 | 881 | 896 | 809 | 994 | 996 | 1,060 | 1,027 |
| 1995 | 1,237 | 1,486 | 1,589 | 1,784 | 2,021 | 1,834 | 1,787 | 1,881 | 1,807 | 1,417 | 704 | 819 |
| 1996 | 740 | 465 | 525 | 501 | 390 | 374 | 332 | 378 | 396 | 759 | 861 | 1,071 |
| 1997 | 1,106 | 1,299 | 1,517 | 1,415 | 1,697 | 1,628 | 1,646 | 1,679 | 1,675 | 1,485 | 1,387 | 1,394 |
| 1998 | 1,471 | 1,445 | 1,362 | 1,741 | 1,667 | 1,322 | 1,203 | 1,241 | 1,343 | 1,311 | 1,292 | 1,276 |
| 1999 | 1,370 | 1,608 | 2,043 | 2,758 | 2,788 | 2,326 | 2,258 | 2,300 | 2,358 | 2,421 | 2,087 | 1,760 |
| 2000 | 1,802 | 2,216 | 2,296 | 2,688 | 2,497 | 2,692 | 2,879 | 2,437 | 2,315 | 1,912 | 1,443 | 1,001 |
| 2001 | 1,287 | 1,196 | 1,434 | 1,564 | 1,577 | 1,740 | 1,858 | 2,132 | 2,190 | 1,600 | 1,844 | 2,175 |
| 2002 | 2,539 | 2,517 | 3,215 | 3,132 | 3,193 | 3,163 | 2,894 | 2,935 | 2,959 | 3,184 | 2,973 | 3,137 |
| 2003 | 3,620 | 2,953 | 3,286 | 3,316 | 3,341 | 3,473 | 3,346 | 3,186 | 3,548 | 3,429 | 3,119 | 2,913 |
| 2004 | 3,203 | 2,778 | 2,784 | 2,434 | 2,601 | 2,119 | 2,266 | 2,654 | 2,630 | 2,759 | 2,558 | 2,547 |
| 2005 | 3,022 | 3,009 | 3,004 | 3,207 | 3,170 | 2,709 | 2,787 | 2,251 | 2,441 | 2,533 | 2,551 | 2,572 |
| 2006 | 3,022 | 3,489 | 3,737 | 3,531 | 2,871 | 2,851 | 3,096 | 3,164 | 3,651 | 3,472 | 2,975 | 3,294 |
| 2007 | 3,317 | 3,321 | 3,309 | 3,290 | 3,217 | 3,364 | 3,523 | 3,835 | 4,315 | 4,105 | 4,101 | 4,369 |
| 2008 | 4,285 | 4,312 | 4,725 | 4,311 | 4,712 | 5,151 | 5,043 | 5,449 | 5,662 | 4,994 | 6,091 | 5,626 |
| 2009 | 5,827 | 5,914 | 5,995 | 5,348 | 5,449 | 4,911 | 5,122 | 5,198 | 5,146 | 5,387 | 5,914 | 6,206 |
| 2010 | 7,245 | 7,906 | 7,454 | 7,204 | 7,403 | 6,461 | 6,136 | 5,683 | 5,900 | 6,405 | 6,782 | 6,951 |
| 2011 | 8,274 | 8,848 | 8,076 | 8,054 | 8,215 | 7,164 | 7,660 | 7,232 | 7,435 | 7,269 | 7,125 | 7,204 |
| 2012 | 7,958 | 8,044 | 8,177 | 7,958 | 7,332 | 7,594 | 7,374 | 6,742 | 7,380 | 6,658 | 6,898 | 7,601 |
| 2013 | 6,957 | 6,774 | 7,176 | 6,758 | 6,035 | 6,364 | 6,064 | 5,607 | 5,903 | 5,864 | 6,459 | 6,497 |
| 2014 | 6,835 | 7,284 | 7,577 | 6,806 | 6,660 | 6,982 | 6,516 | 6,811 | 6,620 | 6,016 | 6,763 | 6,931 |
| 2015 | 7,576 | 7,878 | 7,591 | 7,055 | 7,417 | 7,372 | 7,175 | 7,199 | 6,363 | 6,904 | 7,708 | 7,926 |
| 2016 | 8,771 | 8,860 | 8,736 | 7,682 | 7,829 | 7,431 | 8,327 | 7,812 | 7,181 | 7,793 | 7,614 | 7,918 |
| 2017 | 8,807 | 9,637 | 9,285 | 9,578 | 8,912 | 7,887 | 8,243 | 8,156 | 7,778 | 8,539 | 9,026 | 9,745 |
| 2018 | 9,771 | 10,241 | 9,658 | 8,983 | 8,473 | 8,214 | 8,313 | 8,225 | 9,042 | 8,688 | 8,691 | 9,561 |
| 2019 | 9,698 | 10,330 | 10,306 | 9,571 | 8,991 | 9,379 | 8,688 | 8,483 | 8,056 | 7,851 | 8,263 | 8,660 |
| 2020 | 9,135 | 9,371 | 9,662 | 9,436 | 8,519 | 7,799 | 7,583 | 7,615 | 7,341 | 8,895 | 10,230 | 10,432 |
| 2021 | 11,575 | 10,724 | 9,667 | 9,097 | 10,186 | 9,188 | 9,312 | 8,684 | 8,003 | 8,908 | 9,442 | 10,466 |
| 2022 | 12,045 | 12,567 | 11,895 | 11,341 | 10,732 | 9,888 | 10,875 | 9,683 | 8,585 | 9,661 | 10,336 | 10,942 |
| 2023 | 11,654 | 12,016 | 11,895 | 10,994 | 10,189 | 9,496 | 10,340 | 9,130 | 9,594 | 9,601 | 9,653 | 10,940 |
| 2024 | 10,957 | 11,778 | ||||||||||
| - = No Data Reported; -- = Not Applicable; NA = Not Available; W = Withheld to avoid disclosure of individual company data. |
| Release Date: 4/30/2024 |
| Next Release Date: 5/31/2024 |