|
Download Data (XLS File) |
|
||||||||
|
||||||||
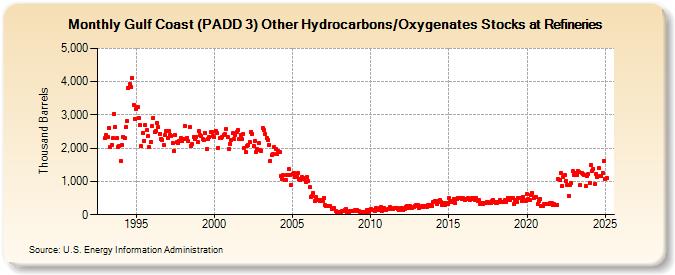
| Gulf Coast (PADD 3) Other Hydrocarbons/Oxygenates Stocks at Refineries (Thousand Barrels) | ||||||||
| Year | Jan | Feb | Mar | Apr | May | Jun | Jul | Aug | Sep | Oct | Nov | Dec |
|---|---|---|---|---|---|---|---|---|---|---|---|---|
| 1993 | 2,297 | 2,384 | 2,335 | 2,609 | 2,027 | 2,105 | 2,292 | 3,036 | 2,639 | 2,306 | 2,049 | 2,079 |
| 1994 | 1,624 | 2,096 | 2,351 | 2,319 | 2,631 | 2,818 | 3,805 | 3,926 | 3,845 | 4,105 | 3,291 | 2,886 |
| 1995 | 3,179 | 3,245 | 2,910 | 2,683 | 2,051 | 2,458 | 2,231 | 2,686 | 2,545 | 2,352 | 2,043 | 2,184 |
| 1996 | 2,673 | 2,916 | 2,501 | 2,513 | 2,770 | 2,636 | 2,438 | 2,284 | 2,248 | 2,101 | 2,393 | 2,523 |
| 1997 | 2,317 | 2,528 | 2,407 | 2,377 | 2,156 | 1,929 | 2,410 | 2,177 | 2,143 | 2,231 | 2,303 | 2,213 |
| 1998 | 2,265 | 2,674 | 2,285 | 2,308 | 2,204 | 2,638 | 2,080 | 2,121 | 2,337 | 2,286 | 2,337 | 2,178 |
| 1999 | 2,508 | 2,394 | 2,352 | 2,271 | 2,247 | 2,471 | 1,976 | 2,289 | 2,332 | 2,473 | 2,479 | 2,361 |
| 2000 | 2,324 | 2,528 | 2,453 | 2,018 | 2,292 | 2,300 | 2,340 | 2,408 | 2,415 | 2,572 | 2,342 | 1,984 |
| 2001 | 2,138 | 2,246 | 2,447 | 2,280 | 2,398 | 2,486 | 2,548 | 2,263 | 2,397 | 2,277 | 2,441 | 2,006 |
| 2002 | 1,873 | 2,069 | 2,107 | 2,175 | 2,492 | 2,434 | 2,061 | 2,230 | 1,879 | 1,967 | 2,141 | 1,953 |
| 2003 | 1,928 | 2,602 | 2,545 | 2,430 | 2,311 | 2,256 | 2,105 | 1,617 | 1,792 | 1,833 | 2,021 | 1,984 |
| 2004 | 1,817 | 1,908 | 1,879 | 1,174 | 1,084 | 1,182 | 1,049 | 1,038 | 1,201 | 1,364 | 1,207 | 904 |
| 2005 | 1,224 | 1,262 | 1,131 | 1,152 | 1,240 | 1,062 | 1,042 | 1,128 | 1,117 | 1,072 | 981 | 1,120 |
| 2006 | 1,018 | 829 | 542 | 549 | 649 | 419 | 527 | 444 | 447 | 411 | 438 | 420 |
| 2007 | 511 | 296 | 251 | 260 | 275 | 254 | 175 | 204 | 196 | 116 | 64 | 70 |
| 2008 | 79 | 90 | 110 | 97 | 142 | 169 | 75 | 66 | 115 | 125 | 111 | 110 |
| 2009 | 132 | 151 | 124 | 105 | 93 | 92 | 62 | 82 | 94 | 137 | 133 | 95 |
| 2010 | 161 | 130 | 139 | 126 | 202 | 133 | 135 | 198 | 225 | 126 | 201 | 145 |
| 2011 | 141 | 160 | 185 | 222 | 160 | 180 | 189 | 192 | 202 | 184 | 153 | 207 |
| 2012 | 198 | 129 | 172 | 237 | 255 | 206 | 254 | 199 | 207 | 233 | 257 | 280 |
| 2013 | 279 | 200 | 229 | 254 | 240 | 252 | 273 | 234 | 284 | 270 | 301 | 276 |
| 2014 | 397 | 405 | 388 | 329 | 404 | 433 | 389 | 292 | 366 | 307 | 360 | 322 |
| 2015 | 500 | 394 | 405 | 393 | 477 | 349 | 463 | 513 | 506 | 515 | 479 | 507 |
| 2016 | 430 | 477 | 479 | 502 | 437 | 467 | 502 | 493 | 446 | 490 | 425 | 438 |
| 2017 | 326 | 349 | 332 | 367 | 358 | 381 | 381 | 367 | 355 | 410 | 449 | 392 |
| 2018 | 364 | 351 | 386 | 439 | 370 | 387 | 382 | 434 | 373 | 513 | 435 | 449 |
| 2019 | 488 | 488 | 314 | 456 | 390 | 492 | 497 | 501 | 405 | 535 | 435 | 406 |
| 2020 | 614 | 469 | 453 | 585 | 662 | 505 | 534 | 521 | 324 | 413 | 479 | 248 |
| 2021 | 258 | 312 | 312 | 330 | 326 | 315 | 358 | 339 | 295 | 316 | 283 | 307 |
| 2022 | 1,070 | 1,040 | 1,251 | 864 | 1,124 | 1,189 | 1,010 | 893 | 568 | 906 | 956 | 1,300 |
| 2023 | 1,196 | 1,253 | 1,185 | 1,310 | 1,276 | 883 | 1,247 | 1,212 | 1,189 | 860 | 1,152 | 1,211 |
| 2024 | 964 | 1,500 | 1,325 | 1,375 | ||||||||
| - = No Data Reported; -- = Not Applicable; NA = Not Available; W = Withheld to avoid disclosure of individual company data. |
| Release Date: 6/28/2024 |
| Next Release Date: 7/31/2024 |