|
Download Data (XLS File) |
|
||||||||
|
||||||||
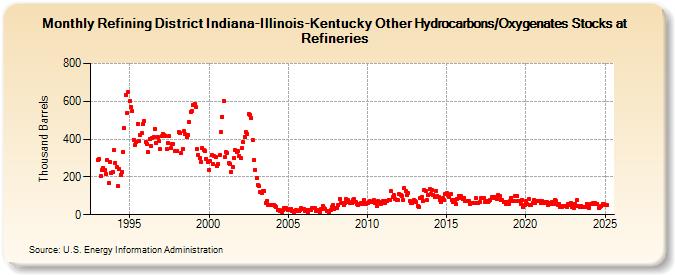
| Refining District Indiana-Illinois-Kentucky Other Hydrocarbons/Oxygenates Stocks at Refineries (Thousand Barrels) | ||||||||
| Year | Jan | Feb | Mar | Apr | May | Jun | Jul | Aug | Sep | Oct | Nov | Dec |
|---|---|---|---|---|---|---|---|---|---|---|---|---|
| 1993 | 291 | 295 | 203 | 235 | 249 | 235 | 218 | 287 | 167 | 280 | 220 | 228 |
| 1994 | 341 | 276 | 252 | 154 | 244 | 212 | 228 | 333 | 458 | 633 | 540 | 647 |
| 1995 | 599 | 572 | 548 | 397 | 371 | 383 | 481 | 391 | 424 | 430 | 478 | 497 |
| 1996 | 385 | 375 | 331 | 401 | 365 | 407 | 412 | 455 | 379 | 413 | 389 | 347 |
| 1997 | 415 | 429 | 421 | 419 | 345 | 380 | 416 | 352 | 374 | 373 | 335 | 336 |
| 1998 | 335 | 438 | 430 | 327 | 348 | 442 | 425 | 409 | 422 | 493 | 545 | 549 |
| 1999 | 580 | 586 | 572 | 347 | 315 | 298 | 280 | 354 | 344 | 335 | 295 | 280 |
| 2000 | 237 | 282 | 314 | 268 | 308 | 307 | 257 | 268 | 315 | 436 | 519 | 604 |
| 2001 | 306 | 331 | 325 | 273 | 269 | 226 | 251 | 300 | 343 | 331 | 337 | 313 |
| 2002 | 299 | 351 | 383 | 413 | 436 | 429 | 532 | 528 | 511 | 393 | 292 | 239 |
| 2003 | 195 | 158 | 150 | 118 | 116 | 128 | 125 | 63 | 74 | 53 | 50 | 51 |
| 2004 | 49 | 52 | 46 | 43 | 23 | 24 | 18 | 17 | 24 | 37 | 36 | 30 |
| 2005 | 26 | 27 | 32 | 21 | 16 | 18 | 23 | 21 | 20 | 23 | 33 | 29 |
| 2006 | 31 | 22 | 24 | 17 | 27 | 23 | 38 | 37 | 34 | 22 | 26 | 19 |
| 2007 | 15 | 30 | 47 | 36 | 28 | 22 | 21 | 15 | 23 | 42 | 51 | 31 |
| 2008 | 38 | 33 | 50 | 84 | 60 | 61 | 50 | 62 | 81 | 80 | 66 | 63 |
| 2009 | 64 | 79 | 81 | 69 | 56 | 54 | 59 | 63 | 55 | 78 | 62 | 57 |
| 2010 | 63 | 66 | 70 | 66 | 67 | 76 | 60 | 44 | 70 | 67 | 58 | 60 |
| 2011 | 71 | 60 | 75 | 70 | 80 | 80 | 123 | 92 | 102 | 83 | 80 | 76 |
| 2012 | 110 | 106 | 99 | 77 | 141 | 125 | 104 | 114 | 70 | 63 | 60 | 78 |
| 2013 | 74 | 67 | 47 | 41 | 90 | 94 | 75 | 131 | 128 | 76 | 104 | 138 |
| 2014 | 111 | 133 | 104 | 93 | 126 | 99 | 93 | 77 | 67 | 89 | 77 | 107 |
| 2015 | 113 | 104 | 93 | 107 | 78 | 69 | 78 | 57 | 85 | 97 | 90 | 97 |
| 2016 | 82 | 90 | 73 | 75 | 73 | 72 | 59 | 62 | 64 | 64 | 86 | 61 |
| 2017 | 64 | 68 | 89 | 89 | 86 | 66 | 75 | 68 | 71 | 78 | 92 | 95 |
| 2018 | 91 | 94 | 85 | 105 | 98 | 80 | 79 | 65 | 69 | 56 | 66 | 58 |
| 2019 | 75 | 91 | 73 | 75 | 97 | 101 | 70 | 72 | 59 | 80 | 41 | 51 |
| 2020 | 72 | 56 | 83 | 54 | 51 | 63 | 78 | 60 | 73 | 75 | 73 | 63 |
| 2021 | 72 | 68 | 61 | 66 | 67 | 49 | 60 | 59 | 66 | 57 | 80 | 73 |
| 2022 | 52 | 58 | 39 | 41 | 47 | 46 | 47 | 42 | 57 | 49 | 61 | 40 |
| 2023 | 38 | 58 | 46 | 76 | 48 | 40 | 47 | 39 | 43 | 41 | 58 | 50 |
| 2024 | 37 | |||||||||||
| - = No Data Reported; -- = Not Applicable; NA = Not Available; W = Withheld to avoid disclosure of individual company data. |
| Release Date: 3/29/2024 |
| Next Release Date: 4/30/2024 |