|
Download Data (XLS File) |
|
||||||||
|
||||||||
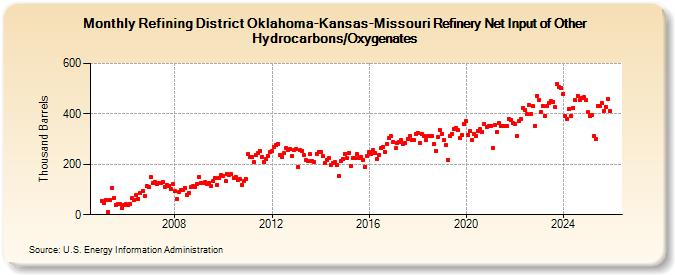
| Refining District Oklahoma-Kansas-Missouri Refinery Net Input of Other Hydrocarbons/Oxygenates (Thousand Barrels) | ||||||||
| Year | Jan | Feb | Mar | Apr | May | Jun | Jul | Aug | Sep | Oct | Nov | Dec |
|---|---|---|---|---|---|---|---|---|---|---|---|---|
| 2005 | 56 | 47 | 58 | 10 | 58 | 106 | 67 | 39 | 41 | 41 | 26 | 38 |
| 2006 | 41 | 39 | 44 | 65 | 59 | 78 | 63 | 87 | 93 | 76 | 115 | 110 |
| 2007 | 150 | 125 | 131 | 120 | 124 | 125 | 128 | 110 | 118 | 115 | 101 | 120 |
| 2008 | 93 | 63 | 90 | 99 | 97 | 106 | 79 | 86 | 108 | 112 | 111 | 123 |
| 2009 | 151 | 125 | 127 | 128 | 122 | 124 | 112 | 132 | 147 | 119 | 146 | 157 |
| 2010 | 154 | 133 | 163 | 159 | 160 | 146 | 149 | 138 | 142 | 117 | 132 | 143 |
| 2011 | 240 | 228 | 230 | 208 | 237 | 245 | 254 | 230 | 209 | 220 | 233 | 250 |
| 2012 | 251 | 270 | 276 | 281 | 238 | 229 | 243 | 265 | 258 | 260 | 234 | 257 |
| 2013 | 261 | 190 | 255 | 253 | 235 | 217 | 214 | 240 | 212 | 209 | 242 | 249 |
| 2014 | 249 | 231 | 204 | 219 | 225 | 198 | 206 | 209 | 198 | 155 | 212 | 221 |
| 2015 | 242 | 224 | 246 | 193 | 226 | 224 | 241 | 226 | 229 | 217 | 191 | 231 |
| 2016 | 250 | 241 | 255 | 243 | 221 | 236 | 265 | 269 | 250 | 282 | 303 | 311 |
| 2017 | 290 | 263 | 285 | 287 | 296 | 282 | 284 | 302 | 311 | 297 | 298 | 321 |
| 2018 | 325 | 286 | 322 | 313 | 296 | 313 | 313 | 311 | 280 | 254 | 309 | 337 |
| 2019 | 321 | 297 | 276 | 219 | 312 | 322 | 342 | 343 | 336 | 304 | 315 | 359 |
| 2020 | 370 | 317 | 332 | 295 | 322 | 312 | 334 | 339 | 328 | 360 | 347 | 350 |
| 2021 | 350 | 266 | 355 | 327 | 363 | 352 | 352 | 351 | 350 | 380 | 377 | 365 |
| 2022 | 360 | 311 | 370 | 381 | 423 | 416 | 398 | 437 | 401 | 430 | 353 | 472 |
| 2023 | 456 | 409 | 433 | 393 | 430 | 443 | 450 | 447 | 426 | 520 | 505 | 502 |
| 2024 | 480 | 390 | 380 | 418 | 392 | 424 | ||||||
| - = No Data Reported; -- = Not Applicable; NA = Not Available; W = Withheld to avoid disclosure of individual company data. |
| Release Date: 8/30/2024 |
| Next Release Date: 9/30/2024 |