|
Download Data (XLS File) |
|
||||||||
|
||||||||
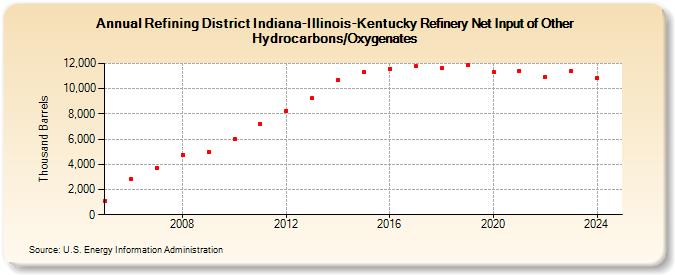
| Refining District Indiana-Illinois-Kentucky Refinery Net Input of Other Hydrocarbons/Oxygenates (Thousand Barrels) | ||||||||
| Decade | Year-0 | Year-1 | Year-2 | Year-3 | Year-4 | Year-5 | Year-6 | Year-7 | Year-8 | Year-9 |
|---|---|---|---|---|---|---|---|---|---|---|
| 2000's | 1,091 | 2,868 | 3,706 | 4,775 | 5,015 | |||||
| 2010's | 6,030 | 7,234 | 8,257 | 9,252 | 10,722 | 11,328 | 11,582 | 11,797 | 11,606 | 11,865 |
| 2020's | 11,303 | 11,431 | 10,928 | 11,371 |
| - = No Data Reported; -- = Not Applicable; NA = Not Available; W = Withheld to avoid disclosure of individual company data. |
| Release Date: 3/29/2024 |
| Next Release Date: 8/30/2024 |